


Every few years a headline announces that some new blockbuster has become the “biggest movie of all time,” only for someone in the comments to point out that Gone with the Wind still wins once you factor in inflation. That argument has been going on for decades, and it never really gets resolved, mostly because the math behind inflation adjustment is more complicated than a simple dollar conversion. Understanding how these lists actually get built helps explain why a film from 1939 can still outrank a modern release that made ten times as much money on paper.
Why raw dollar totals distort the picture


A movie released in 2026 sells tickets that average close to eleven dollars in many markets, while a film from the 1970s sold tickets for around two dollars. That means a modern movie can generate a bigger headline number simply by existing in a more expensive era, not because more people actually went to see it.
Guinness World Records has noted plainly that the cost of cinema tickets rises with inflation, which means that a film released now will make far more money in absolute terms than a similarly successful film from decades past. That single fact is the entire reason adjusted lists exist. Without correcting for it, any ranking of “biggest hits” is really just a ranking of which films happened to release during the priciest years for popcorn and tickets.
The two main adjustment methods

There are basically two ways analysts try to level the playing field. The first uses the Consumer Price Index, a broad measure of inflation across the whole economy, and simply reprices an old box office total in today’s dollars. The second, more specific method uses average movie ticket prices instead of general inflation, since ticket costs have not always tracked overall inflation exactly.
One inflation calculator built for this purpose explains the CPI approach directly: it then multiplies the gross by the ratio of today’s value to the year’s value, so $100 million in 1990 becomes roughly $233 million in 2023 CPI dollars. The ticket price method works on a similar ratio, but it is considered more accurate for film specifically because the ticket price adjustment works the same way using average ticket costs. Most serious box office historians prefer the ticket price version for this reason.
Why counting tickets sold matters more than counting dollars


The real goal of any adjusted list is not actually about money at all. It is about estimating how many people physically walked into a theater and bought a seat, since that number reflects popularity in a way that is immune to currency changes.
Box Office Mojo, the industry’s most widely cited tracking site, explains its process this way: to adjust for inflation, the estimated number of tickets sold is multiplied by the average ticket price of the selected year. Before that step happens, the site has to reverse engineer the ticket count itself. The chart also displays the estimated number of tickets sold for each movie by taking its box office gross and dividing it by the average ticket price at the time it was released. Once you have an admissions estimate, you can restate it at any year’s prices, which is really what an “adjusted gross” chart is showing.
Where the ticket price and CPI data actually come from


These adjustments are not guesses pulled from thin air. Analysts rely on decades of tracked pricing data compiled by industry groups and government statisticians.
According to one tool that documents its sourcing, the CPI values come from the U.S. Bureau of Labor Statistics, average ticket prices come from the National Association of Theatre Owners, and total domestic box office revenue is sourced from Box Office Mojo for each year. Box Office Mojo itself has tracked this pricing history for a long stretch of film history, as Wikipedia notes: Box Office Mojo tracks average ticket prices at theaters from 1910 to 2020. That century-plus of pricing data is the backbone almost every adjusted list depends on.
Gone with the Wind and the case for the perennial champion

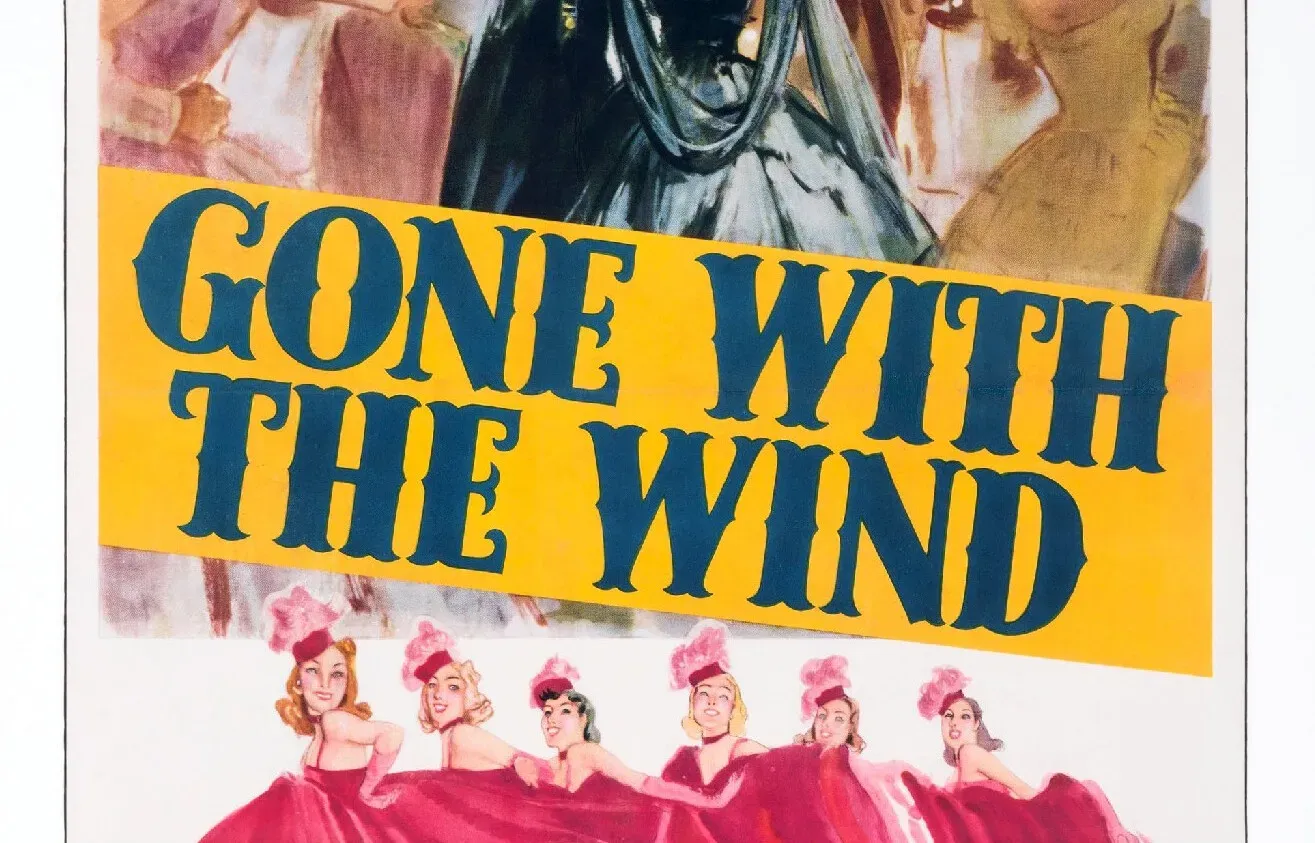
No film illustrates the adjustment gap better than Gone with the Wind. Its original 1939 box office total looks almost quaint by modern standards, yet it dominates every serious inflation-adjusted ranking.
Guinness explains the scale involved: over the course of its first three theatrical runs, which lasted from December 1939 to November 1943, Gone with the Wind sold approximately 202 million tickets in the US alone, and for context, there were only 130 million people living in the US at the time. That level of market saturation, essentially the entire country going to the movies multiple times for one film, is almost impossible to replicate today given how fragmented entertainment options have become. Estimates of its adjusted total vary by source, ranging from around three billion dollars up past four billion, but almost every methodology puts it at or near the top.
Avatar, Titanic, and why modern blockbusters struggle to compete


Avatar and Titanic hold the two biggest unadjusted worldwide totals in film history, and both are frequently mistaken for the “biggest” movies ever made in any sense. Once ticket price inflation enters the conversation, though, their rankings slide considerably.
Guinness is direct about this distinction: Avatar has generated a total of nearly 2.92 billion dollars from worldwide ticket sales, though it would be wrong to call Avatar the biggest film of all time. The reason comes down to admissions rather than dollars. A film selling tickets at nine or ten dollars each simply needs far fewer buyers to hit a record-breaking dollar figure than a film selling tickets for a quarter or fifty cents decades earlier.
How re-releases complicate the math

Many of the classic films sitting atop adjusted lists, including Gone with the Wind, Star Wars, and Snow White and the Seven Dwarfs, did not earn their totals in one theatrical run. They came back to theaters repeatedly over decades, each time adding new admissions at that era’s ticket prices.
Box Office Mojo’s methodology accounts for this directly. Some movies have been released several times over the decades, and in these cases, each release is adjusted according to the year it earned its money. This means a single film’s adjusted total is actually a sum of several smaller calculations stitched together, one for each theatrical run, rather than one clean conversion applied to a lifetime gross figure.
Domestic versus worldwide adjustments and currency headaches

Most adjusted rankings you see quoted in headlines focus on North American, or “domestic,” box office, since that market has the longest and most reliable pricing history. Worldwide adjusted rankings are much messier because they require converting foreign currencies at historical exchange rates on top of adjusting for inflation.
Wikipedia’s entry on science fiction box office rankings flags this complication directly: the price index used to adjust the grosses, and the exchange rates used to convert between currencies, can also affect the calculations, both of which can have an effect on the ultimate rankings of an inflation adjusted list. That is one reason domestic-only adjusted lists tend to be treated as more trustworthy than global ones, even though global totals get more attention in press coverage.
Why different sources produce different numbers for the same film

If you compare adjusted totals for Gone with the Wind across five different sources, you will likely get five different dollar figures. This is not sloppiness so much as a reflection of genuinely different underlying assumptions about admissions and pricing history.
Wikipedia lays out the spread plainly: estimates for Gone with the Wind’s adjusted gross have varied substantially, with Turner Entertainment estimating its adjusted earnings at 3.3 billion dollars in 2007, while other estimates fall either side of this amount, with one putting its gross just under three billion dollars in 2010, and another providing an alternative figure of 3.8 billion dollars in 2006. Even the choice of runner-up shifts depending on the source, since which film is Gone with the Wind’s nearest rival depends on the set of figures used, with Guinness placing Avatar in second with three billion dollars, while other estimates put Titanic in the runner up spot. None of these figures are wrong exactly, they are just built on slightly different admission estimates and price benchmarks.
What adjusted rankings can and cannot tell us


Inflation adjustment is a useful corrective, but it is not a perfect science, and serious analysts treat it as an estimate rather than an exact figure. It works best as a rough ordering of cultural reach rather than a precise financial record, since ticket counts for very old films often rely on studio archives rather than modern point of sale data.
It is also worth remembering what these lists leave out entirely. Wikipedia points out that theatrical figures alone don’t capture the full picture: claims about the “highest grossing” film usually refer to theatrical revenues only and do not take into account home video and television income, and once that revenue is factored in, it is not immediately clear which film is the most successful. That caveat applies just as much to adjusted lists as unadjusted ones, since neither accounts for streaming, merchandising, or home entertainment income that modern films increasingly depend on.
Reading these lists with the right context


The next time a studio announces a “record breaking opening weekend,” it is worth remembering that the record almost always refers to raw dollars, not adjusted ones. Inflation adjusted charts tell a different, arguably more honest story about which films actually reached the widest audience relative to their own era.
Gone with the Wind’s continued presence at the top of these lists is less about nostalgia and more about a simple arithmetic reality: a huge share of an entire nation bought tickets to see it, repeatedly, at a time when going to the movies was one of the only entertainment options available. That kind of market saturation is not something any modern release, no matter how big its opening weekend, is likely to match again.


