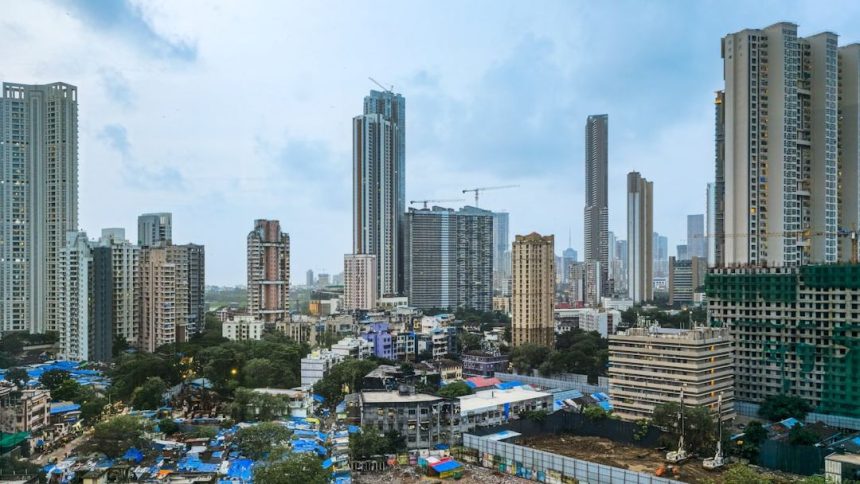
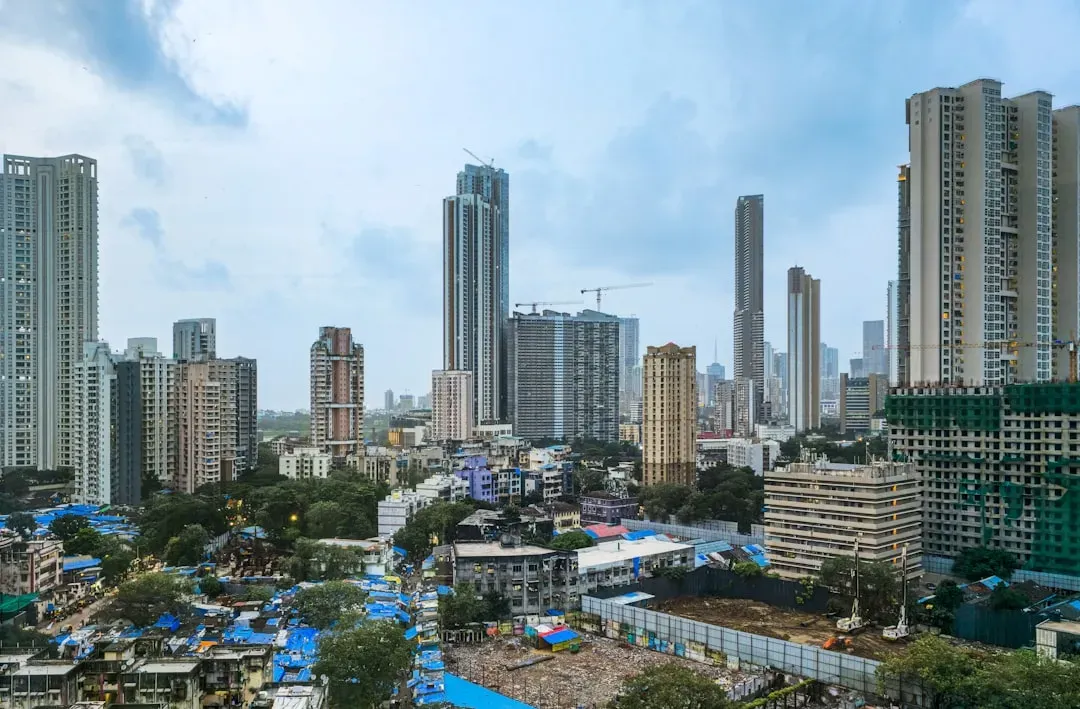
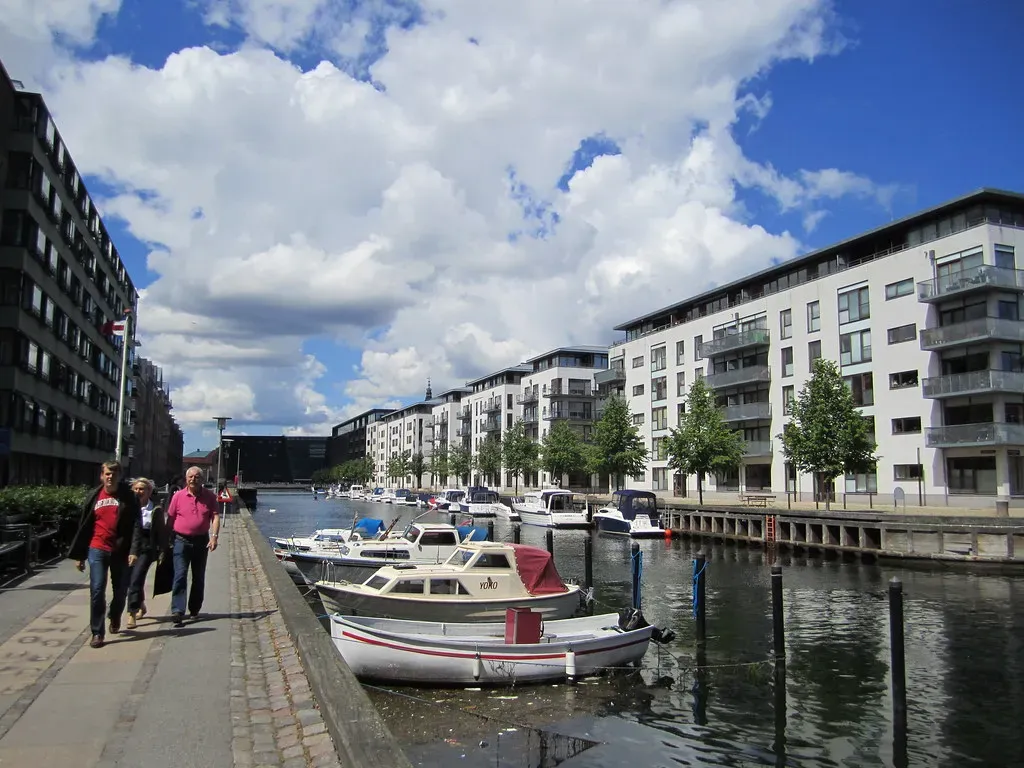
There’s a street in your city that most people drive down every single day without ever thinking twice about it. On one side, homes are quietly, steadily gaining value year after year. On the other side, they’re barely keeping up with inflation. Same road. Same zip code. Wildly different financial destinies.
This is the equity gap in action – and it isn’t a theory. It’s happening in real neighborhoods, in real cities, right now. The gap between a home that appreciates at a healthy clip versus one that stagnates can mean the difference between generational wealth and decades of financial struggle. What drives it? The answer is more layered, more unsettling, and honestly, more fascinating than most people expect. Let’s dive in.
The Two-Speed Housing Market Hidden in Plain Sight

Here’s the thing – most people assume real estate moves in one direction for an entire city at a time. Either it’s a hot market, or it isn’t. But that’s a massive oversimplification. A home’s value is heavily influenced by its specific neighborhood’s desirability, local job growth, and amenities. Two properties a few blocks apart can tell completely different financial stories.
The reality is that home appreciation is a complex interplay of numerous factors, including local market dynamics, economic conditions, interest rates, property characteristics, and even specific neighborhood developments, all of which can lead to considerable variations in how much a home truly gains in value each year. Think of it like this: two runners on the same track, but one has a clear lane and the other is running into headwinds the whole time.
The 2024 housing market featured too few homes on the market and not enough buyers willing to face high prices and mortgage rates – this pushed house prices higher and kept affordability historically low, remarkable given that 2023 ended as the least affordable year for homebuying on record. In that squeeze, high-demand neighborhoods pulled even further ahead. The gap widened, not narrowed.
What the National Data Actually Tells Us

Let’s get some numbers on the table first, because the national story is the backdrop against which local inequities play out. Following two straight quarters of deceleration, house price appreciation actually accelerated slightly in the fourth quarter of 2024 due to persistent high mortgage rates and low inventory. That might sound counterintuitive, but tight supply in desirable areas is a powerful engine.
The U.S. median sale price reached an all-time high in July 2024 when it hit $442,000, eclipsing 2022’s record of $432,000, with house prices hitting record highs for nine straight weeks. When averaging for the entire year, 2024’s median sale price of $428,200 far surpassed any previous year in history, beating the prior year’s by $20,000.
Yet those national averages mask enormous variation. Some markets see much more appreciation than others – homes in New York have risen in value by 7.5%, while those in Florida have gone up by just 1.1%. And within individual cities, the contrasts can be even more extreme. The average is almost misleading in that sense.
The School District Effect: A $205,000 Price Tag on Education

Of all the forces driving the equity gap, school quality might be the single most powerful one. I know it sounds almost unfair when you put it so plainly, but the data is hard to argue with. Across the 100 largest metropolitan areas, housing costs an average of 2.4 times as much near a high-scoring public school than near a low-scoring one, with home values $205,000 higher on average in the neighborhoods of high-scoring schools.
Homes in high-demand school districts typically experience sustained value appreciation, offering excellent investment potential even in fluctuating real estate markets. This creates a self-reinforcing cycle. Higher home values mean higher property tax revenues, which fund better schools, which attract more buyers, which push values higher again.
According to a 2023 study by the National Association of Realtors, 30% of homebuyers listed school quality as a significant factor influencing their home purchase decision. That’s nearly one in three buyers. Even those without children pay attention to school district ratings because they understand what it means for future resale value. The school on one side of Flamingo Road is basically invisible – until you check the price per square foot.
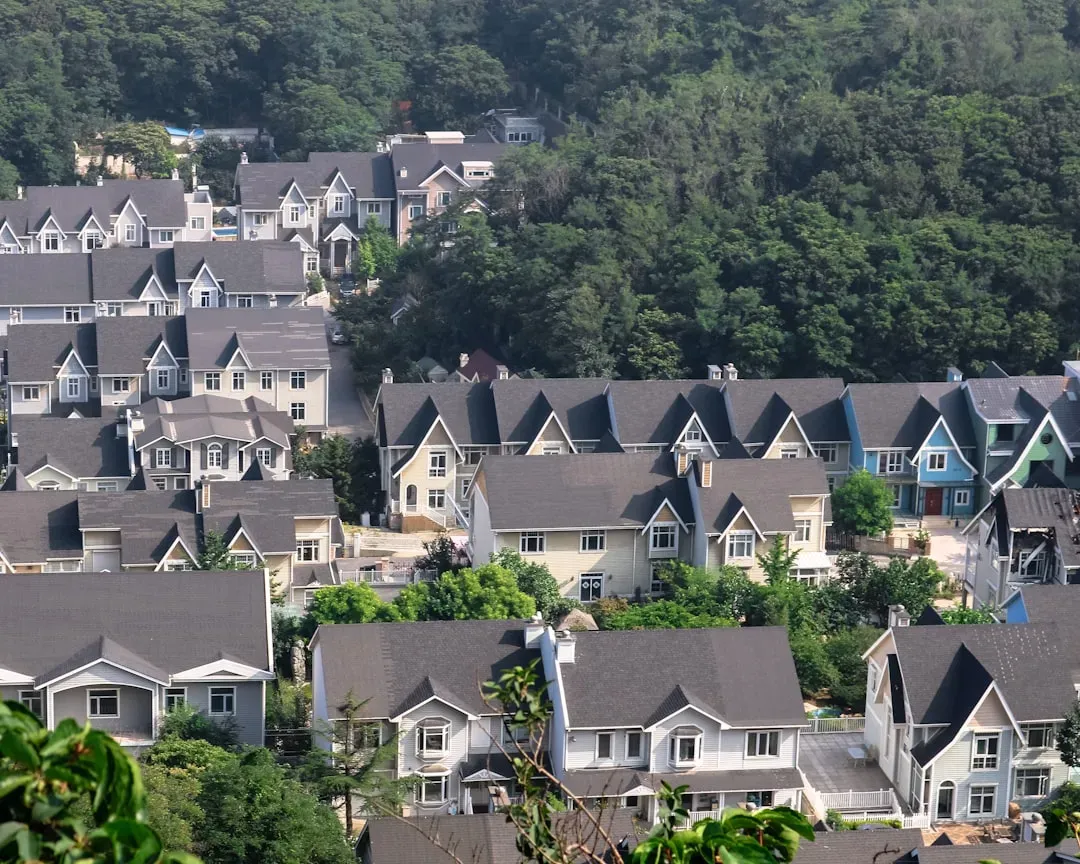
Amenities, Waterfronts, and the Premium of “Nice”

Walk one block closer to the park, the coffee shop strip, or the waterfront – and the price of a home climbs noticeably. This isn’t just a feeling. It’s well-documented. A 2024 Zillow analysis found that homes near desirable amenities such as parks, retail corridors, and waterfronts can sell for up to roughly 15% more than comparable properties without those features nearby.
Properties near amenities maintain better value retention, even in markets that are otherwise adjusting downward. That’s a key distinction. It isn’t just about appreciation in good times – it’s about resilience when things slow down. The home near the park holds its value. The identical home three blocks away from anything interesting does not.
Think of it the way people talk about restaurants. A diner with a waterfront view charges twice as much for the same meal. People willingly pay it. Real estate works exactly the same way, just with much higher stakes and much longer time horizons. The “view premium” or “walkability bonus” compounds quietly over decades into a staggering wealth difference.
How Mortgage Rates Sharpened the Divide

Rising interest rates don’t hit every neighborhood the same way. Honestly, this is one of the less obvious dynamics of the equity gap, and it’s worth slowing down to understand. House price appreciation accelerated slightly in the fourth quarter of 2024 due to the persistent high mortgage rates and low inventory. That seems paradoxical until you dig into why.
Higher rates freeze homeowners in place. High mortgage rates cause current homeowners to hesitate in selling, leading to low inventory and elevated prices. In desirable neighborhoods, that locked-up supply becomes a bidding war trigger. In less desirable neighborhoods, where buyer demand is already softer, the same high rates simply mean fewer buyers and stagnant prices.
Nearly 40% of renters thought they’d never own a home in 2024, and the median homebuying age jumped to a record 56 years old – seven years older than in 2023. This is a symptom of the same dynamic. When getting onto the property ladder becomes this hard, buyers become hyper-selective. They chase the “better” neighborhood with even more intensity, pouring premium demand into already premium areas.
The Long Shadow of Redlining and Historic Policy

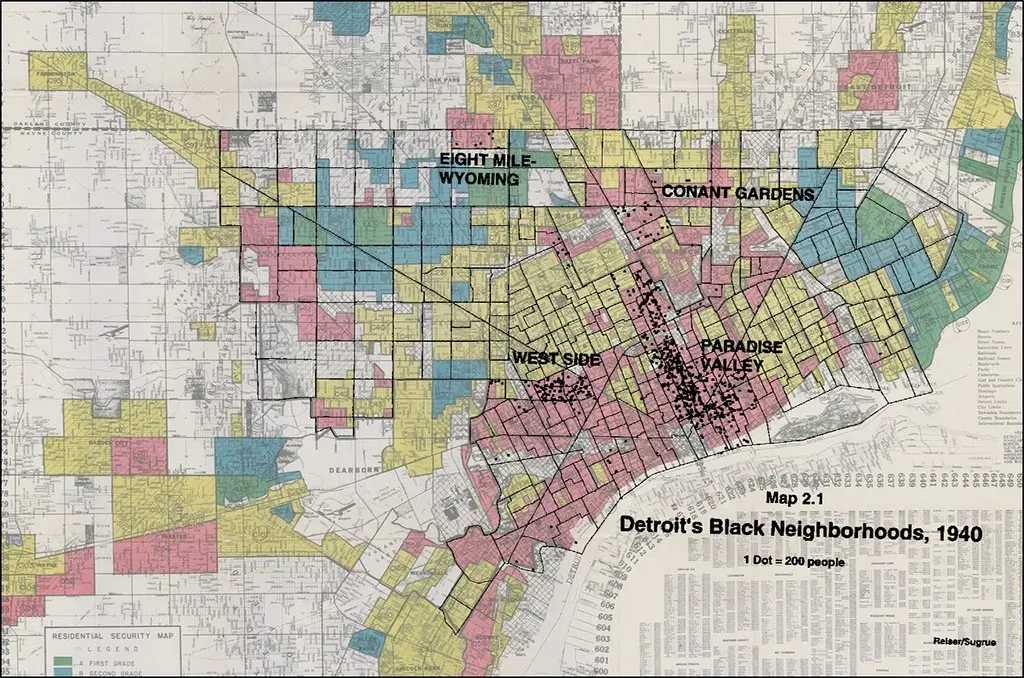
Here’s where the conversation gets harder – and more important. The equity gap between two sides of a street is not always random. In many American cities, it traces almost exactly onto maps drawn nearly a century ago. Redlining – a practice starting in the late 1930s in which real estate and public sector actors developed color-coded maps to identify areas’ “riskiness” – legally blocked groups of people, especially Black households and other households of color, from homeownership opportunities for decades, until the Fair Housing Act of 1968.
Homes in predominantly Black neighborhoods across the country are valued at $48,000 less than predominantly white neighborhoods, for a cumulative loss in equity of approximately $156 billion. That number is staggering. It represents wealth that was never built, never passed down, never compounded over generations.
Historical discriminatory processes such as housing segregation have relegated people of color, particularly Black Americans, to communities with inferior housing, and lower housing appreciation that results often means lower wealth accumulation. The equity gap on Flamingo Road, in other words, didn’t just happen organically. In many cities, it was designed.
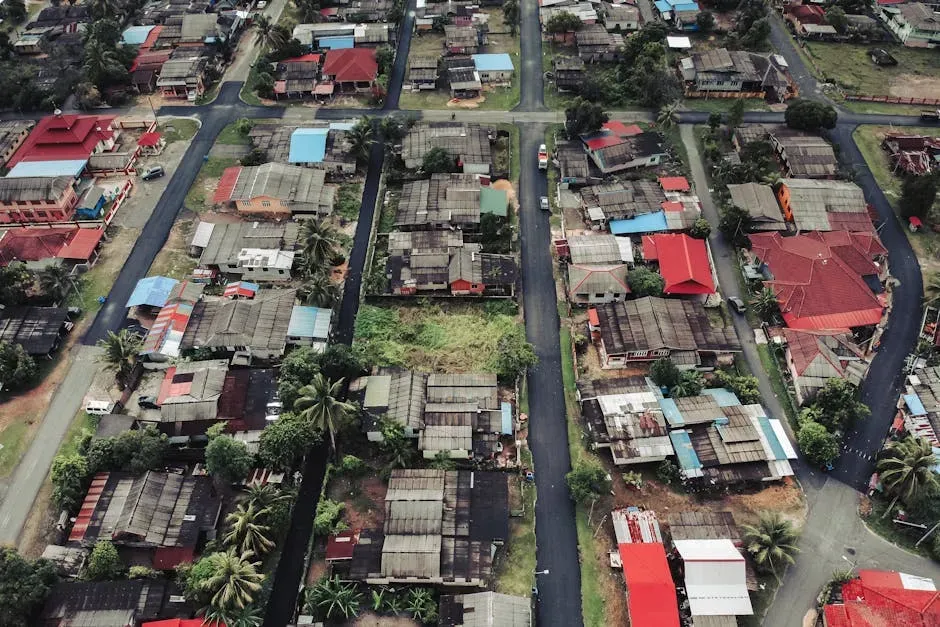
Jobs, Infrastructure, and the Power of Proximity


Here’s a more forward-looking driver of the gap: economic geography. Where you live relative to where jobs are created matters enormously to how fast your home gains value. Proximity to employment hubs can increase home values by 10 to 20 percent over time, according to housing research. And the pattern is consistent across metro areas large and small.
Neighborhoods with strong schools, employment centers, and planned infrastructure improvements are consistently cited as the areas with the strongest long-term appreciation potential. It’s a three-legged stool: jobs bring people, people need schools, and infrastructure improvements make it all more accessible. Take one leg away, and the stool wobbles.
Infrastructure investment is especially interesting because it can be a sudden catalyst. A new transit line or highway extension can transform a previously overlooked neighborhood almost overnight. Research has shown that infrastructure improvements such as transit expansions can raise nearby property values by roughly 5 to 20 percent, depending on the accessibility gains involved. One side of the road gets the new train stop. The other side does not. The gap begins from that moment.
The Compounding Wealth Consequence Nobody Talks About Enough
All of these individual factors – schools, amenities, history, jobs, mortgage dynamics – don’t just affect today’s sale price. They compound. Over the past decade from 2014 to 2024, U.S. home values have risen about 6 to 7 percent per year on average, and even higher over the five years from 2019 to 2024, averaging around 8 to 9 percent annually due to a recent surge. Imagine that rate applied consistently to a home on the “winning” side of Flamingo Road versus a home appreciating at half that pace.
Homeownership is often viewed as the entree to the American dream and the gateway to intergenerational wealth. However, this pathway is often less achievable for Black Americans who post a homeownership rate of 46.4% compared to 75.8% of white families. Lower ownership rates in slower-appreciating neighborhoods mean less wealth being built in those communities over time.
The Black-white racial wealth gap is rooted in decades of policies such as redlining, racially restrictive covenants, and job discrimination. Even with the end of these policies on paper, the homeownership gap is now greater than it was in 1960. The equity gap on a single road is, in many ways, just a small-scale reflection of a much larger, much older national imbalance. Fixing it requires understanding not just the market, but the history underneath it.
Conclusion: The Street That Tells the Whole Story

Flamingo Road is everywhere. It might not carry that name in your city, but there’s a street near you where one side has been quietly compounding wealth for decades while the other has been treading water. It’s a story about schools and parks, yes. It’s also a story about policy choices made long before most current homeowners were born.
Ultimately, how much your home’s value goes up comes down to its desirability in your specific market at a given time. That desirability is shaped by forces that are economic, historical, and deeply human. It’s not just about the house. It’s about everything around it.
The equity gap is real, it’s measurable, and it’s growing in many American cities. The next time you drive down a familiar road and notice how different it looks from one side to the other, remember: that difference isn’t cosmetic. It’s financial. And for millions of American families, it’s the single biggest factor determining whether wealth is built or left behind. What would you have guessed was the biggest driver of that gap before reading this?