

Maps have never been just pieces of paper with lines and colors. They’ve been weapons, tools of propaganda, and sometimes the only thing standing between war and peace. Throughout history, certain maps didn’t just show the world – they literally changed it. Some sparked conflicts that killed millions. Others ended wars or created entirely new nations overnight.
What’s wild is that many of these maps were drawn by people who had never even set foot in the places they were mapping. They made decisions in distant offices that would affect generations of families, splitting communities down the middle or forcing strangers to become neighbors. And here’s the thing – we’re still living with the consequences of those decisions today. Let’s dive in.
The Treaty of Tordesillas Map Split the World Between Two Empires
In 1494, Pope Alexander VI literally drew a line down the middle of the Atlantic Ocean and gave everything on one side to Spain and everything on the other to Portugal. No other nations were consulted. No indigenous peoples were asked. Just two Catholic empires dividing up territories they hadn’t even fully explored yet.
This single map determined why Brazil speaks Portuguese while the rest of South America speaks Spanish. It shaped colonial expansion for centuries and set the stage for European dominance across the Americas, Africa, and Asia. The audacity of two countries claiming to own half the planet each still amazes me.
What makes this map particularly significant is how it normalized the idea that European powers could simply carve up the world among themselves. It established a precedent that would be repeated again and again in different forms for the next four hundred years.
The Sykes-Picot Agreement Created Middle Eastern Borders That Ignite Conflicts Today
In 1916, a British diplomat and a French diplomat met in secret and drew straight lines across a map of the Ottoman Empire. Mark Sykes and François Georges-Picot created borders that paid zero attention to ethnic groups, religious communities, or existing tribal territories. They just drew lines with rulers.
These artificial borders created Iraq, Syria, Lebanon, Jordan, and redrew the entire Middle East. Suddenly, Kurds found themselves split across four different countries. Sunni and Shia communities that had lived separately for centuries were forced into the same nations. The chaos from these decisions still fuels conflicts today.
Every time you hear about tensions in the Middle East, there’s a decent chance the Sykes-Picot map is somewhere in the background. It’s arguably one of the most consequential maps ever drawn, and the men who drew it never faced any accountability for the mess they created.
The agreement was also a betrayal – Britain had simultaneously promised Arab leaders independence if they rebelled against the Ottoman Empire. Instead, they got European colonialism with different flags.
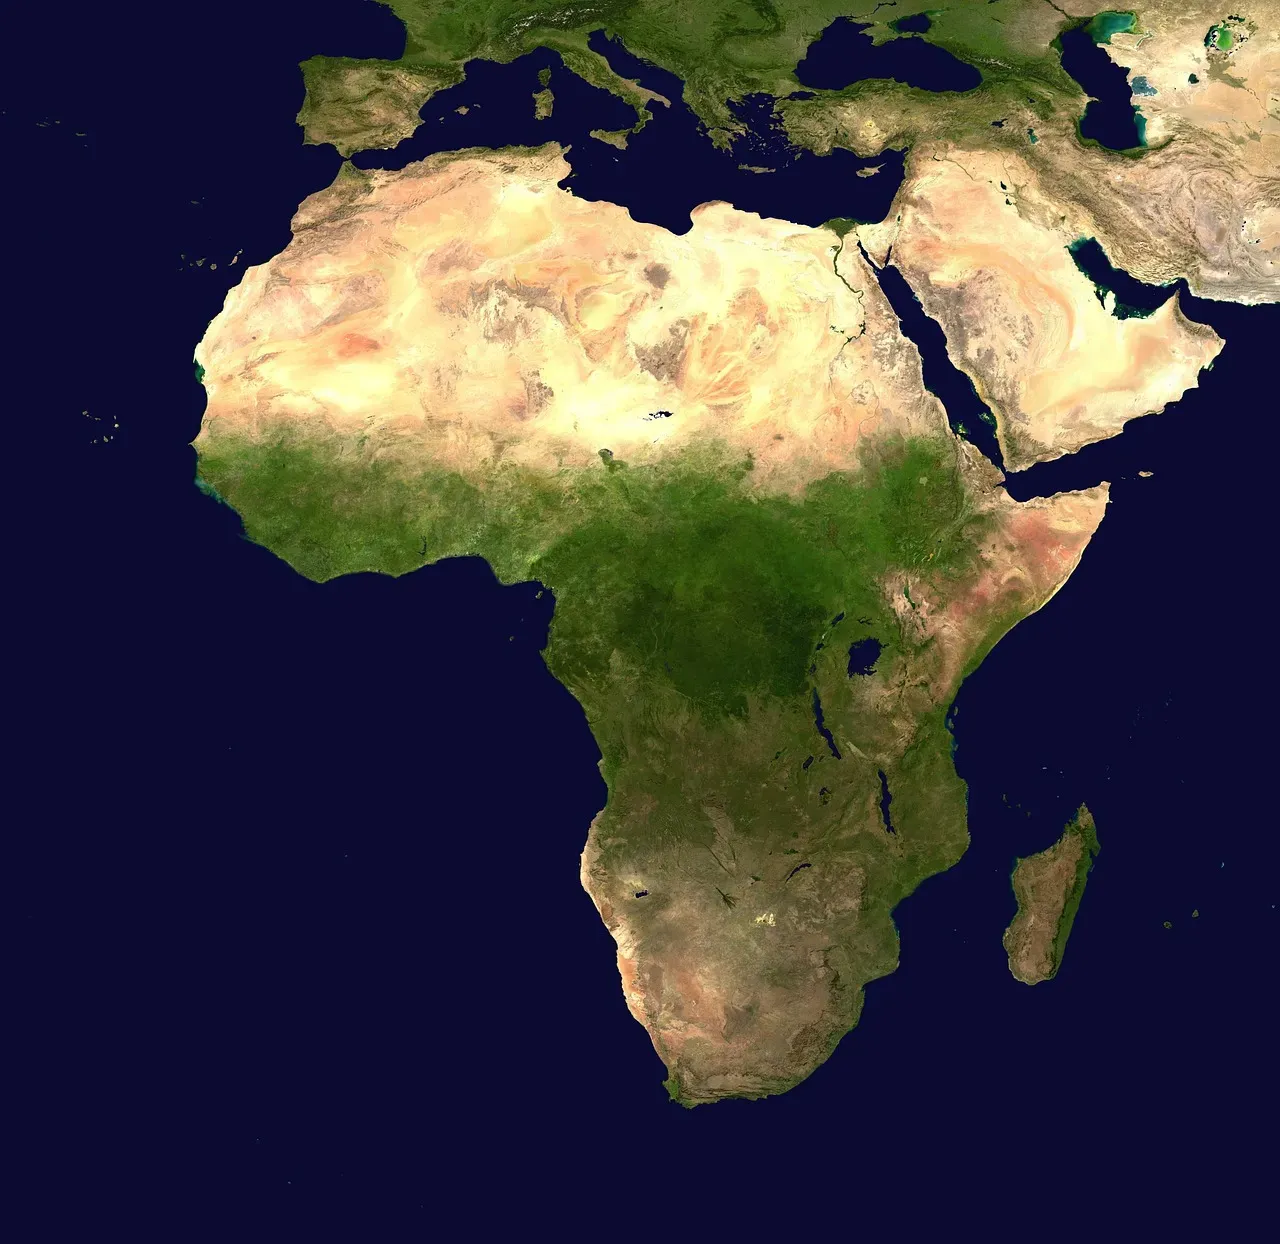
The Berlin Conference Map Carved Up Africa Without a Single African Present
Picture this scene from 1884. Fourteen European nations gathered in Berlin to decide how to divide Africa among themselves. Not one African leader was invited. Not one. They spent months drawing borders through a continent they barely understood, splitting over 10,000 distinct African ethnic groups across arbitrary colonial boundaries.
The map they produced forced traditional enemies to live together and separated families and tribes that had coexisted for centuries. The Belgian Congo, German East Africa, French West Africa – these weren’t natural divisions. They were European inventions designed purely for resource extraction.
The legacy is devastating. Many of Africa’s modern conflicts trace directly back to these colonial borders. Rwanda’s genocide, Nigerian civil wars, Congolese instability – the Berlin Conference map set the stage for all of it. And European powers did this while claiming they were bringing “civilization” to Africa.
The Mercator Projection Warped Our Understanding of the World
Gerardus Mercator created his famous map projection in 1569, and it’s probably the map you grew up seeing in school. It looks familiar and comfortable. It’s also wildly deceptive. The Mercator projection makes countries near the equator look tiny while inflating the size of regions near the poles.
Greenland appears roughly the same size as Africa on a Mercator map. In reality, Africa is fourteen times larger. Europe looks massive compared to South America, but South America is nearly double Europe’s size. This distortion isn’t accidental – it served European colonial interests by making colonizing nations appear more dominant.
For centuries, this map shaped how people perceived global importance and power. It made the Global North seem naturally larger and more significant than the Global South. Only recently have alternative projections started appearing in classrooms, showing the world’s true proportions.
The Mercator map is still everywhere – Google Maps uses a version of it. That’s how deeply this distorted view of the world has been embedded in our consciousness.
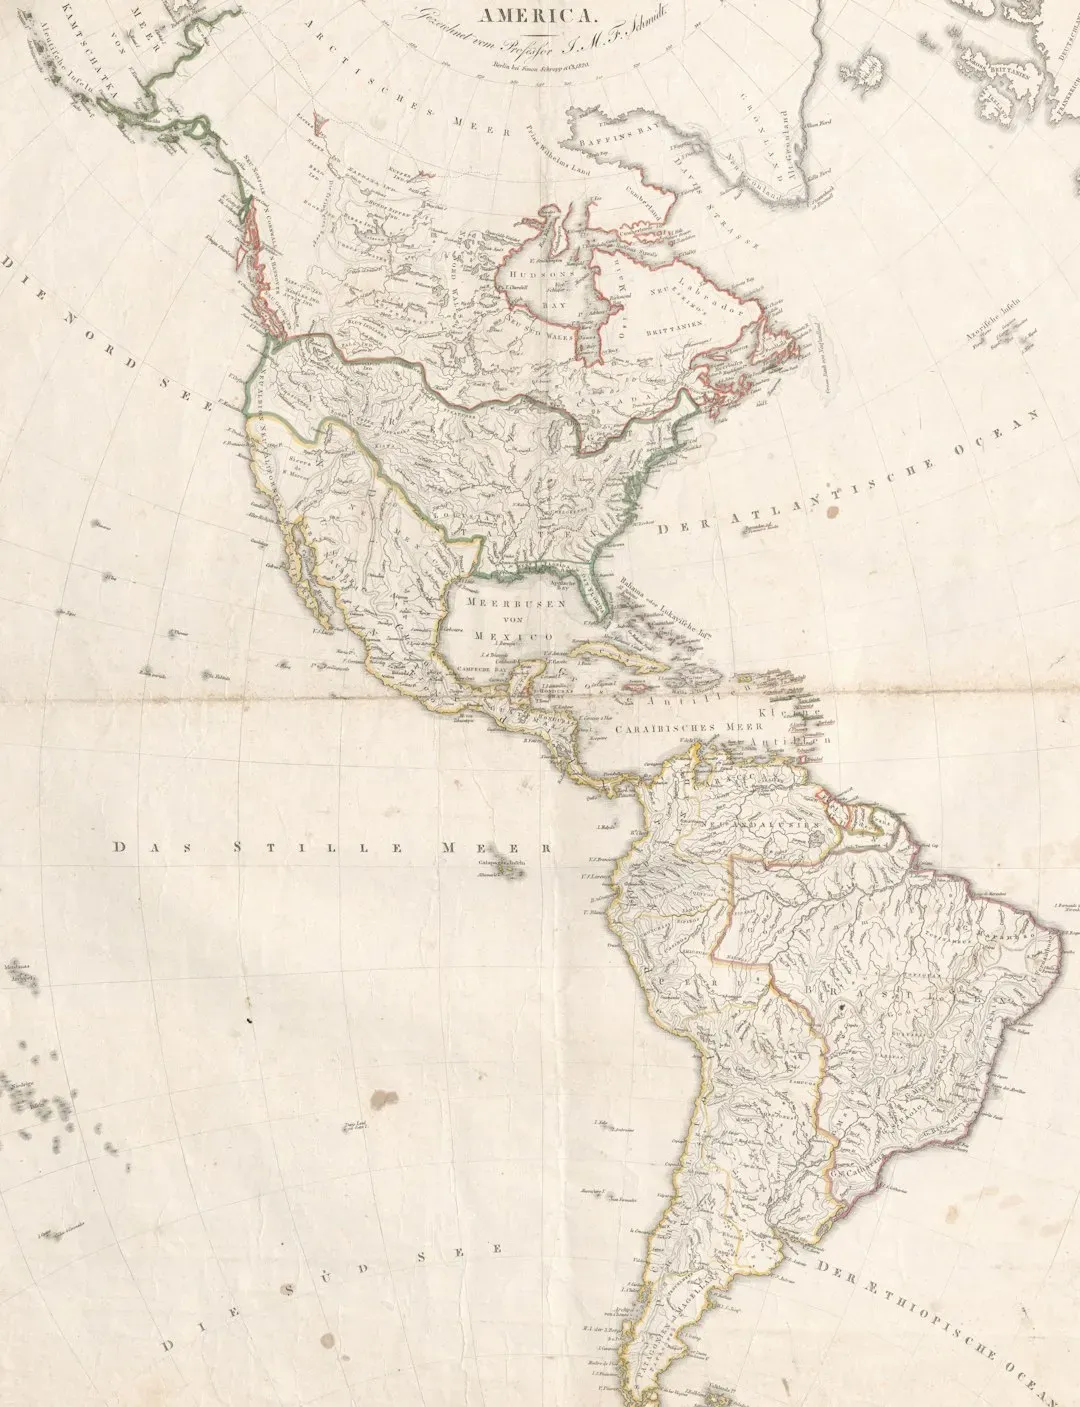
The Louisiana Purchase Map Doubled America’s Size Overnight
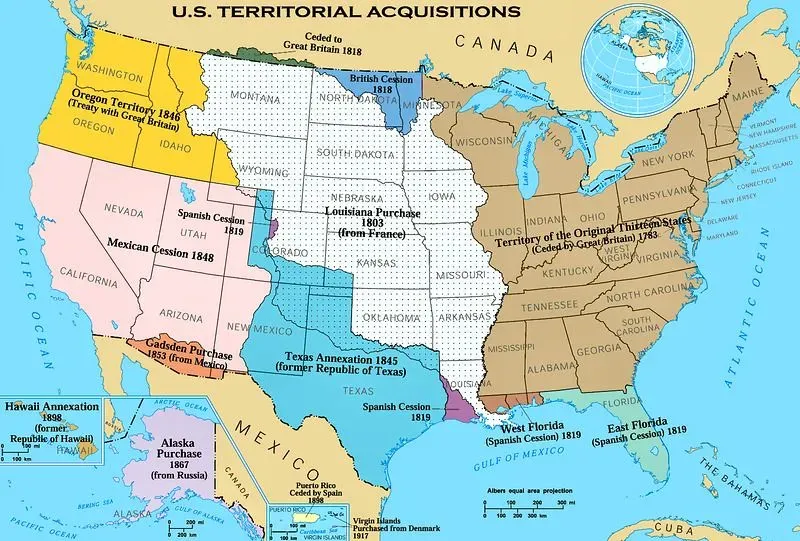
In 1803, Napoleon Bonaparte sold roughly 828,000 square miles of North American territory to the United States for about $15 million. The map documenting this transaction fundamentally altered the future of North America. France got quick cash to fund European wars. America got control of the continent’s interior.
But here’s what’s rarely mentioned – the land Napoleon sold wasn’t really his to sell. Hundreds of thousands of Native Americans lived throughout this territory. Spain also had legitimate claims to portions. France’s ownership was questionable at best. Yet one map and one transaction displaced entire civilizations.
This purchase map determined that America would stretch from ocean to ocean. It made westward expansion inevitable and set the stage for Manifest Destiny. Without this map and the deal it represented, the United States might have remained a narrow strip along the Atlantic coast.
The Partition of India Map Created the Largest Mass Migration in History
In 1947, British lawyer Cyril Radcliffe was given five weeks to draw a border dividing India and Pakistan. He had never been to India before. He had no expertise in South Asian culture, religion, or geography. Yet he drew lines that would affect roughly 600 million people.
The Radcliffe Line, as it became known, triggered immediate catastrophe. Between ten and twenty million people were forced to migrate overnight. Roughly two million died in the resulting violence. Families were separated. Communities that had coexisted for generations suddenly found themselves on opposite sides of a hostile border.
The Kashmir region, which Radcliffe struggled to allocate, remains disputed territory today. India and Pakistan have fought multiple wars over it. Nuclear tensions between the two nations can often be traced back to disagreements rooted in this hastily drawn map.
Radcliffe himself never returned to India and reportedly burned his private papers related to the partition. Even he seemed to understand the magnitude of destruction his map had caused.
The Treaty of Versailles Map Planted Seeds for World War Two
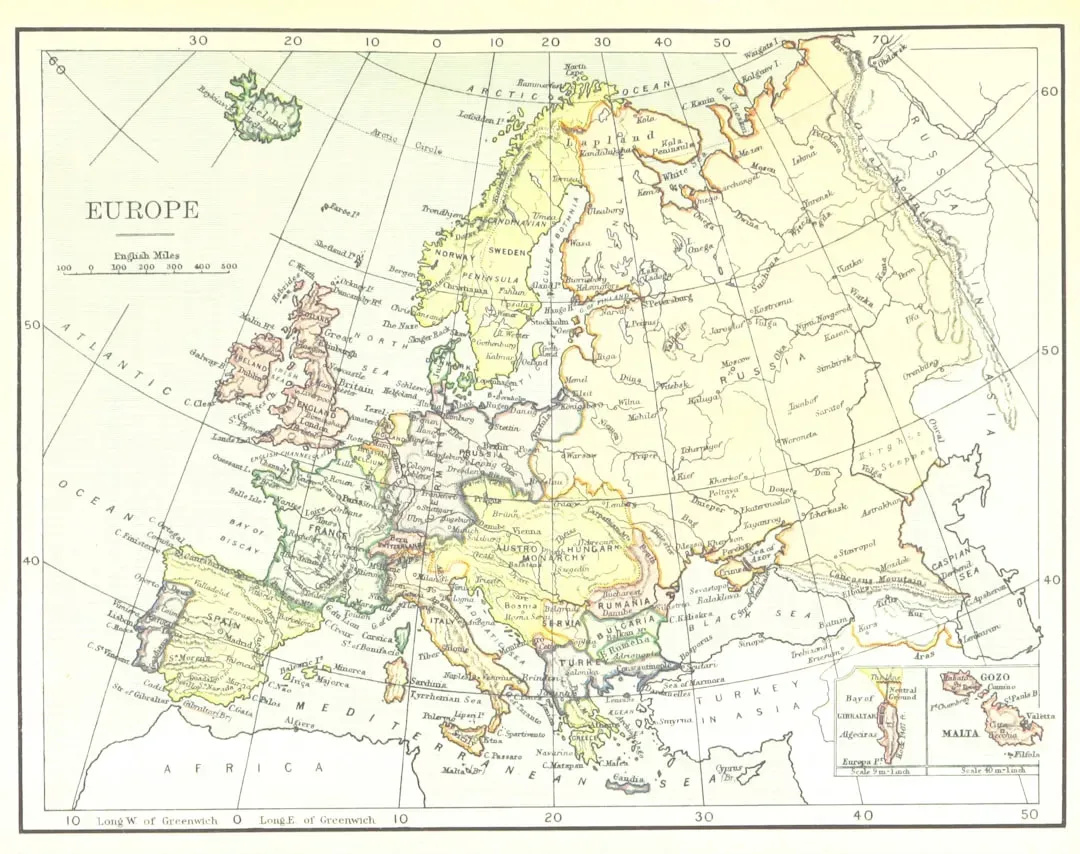
After World War One ended in 1918, the Allied powers redrew Europe’s borders with maps that prioritized punishing Germany over creating lasting peace. They stripped away German territory, dissolved the Austro-Hungarian Empire, and created new nations like Czechoslovakia and Yugoslavia by combining groups that didn’t necessarily want to be together.
The most consequential aspect was creating the Polish Corridor, which separated East Prussia from the rest of Germany. This humiliation became a rallying point for German nationalism. Adolf Hitler would later use these “unjust borders” as justification for aggression, claiming he was merely reclaiming German territory.
Historians broadly agree that the Treaty of Versailles maps made World War Two more likely, possibly inevitable. By redrawing Europe with vengeance rather than wisdom, the Allied powers created conditions ripe for another devastating conflict just twenty years later.
Antarctica Treaty Maps Prevented a Potential Conflict Zone
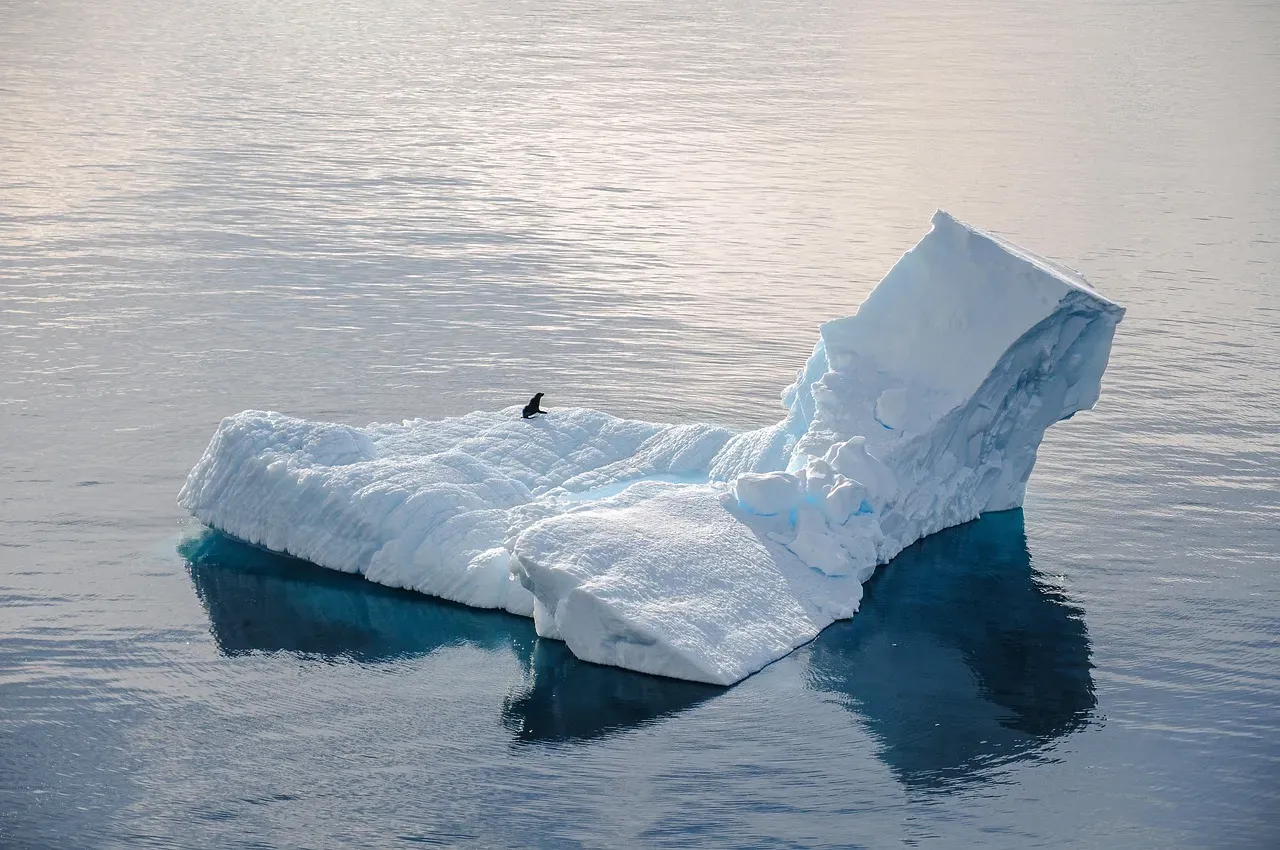
Here’s a rare example where mapping prevented rather than caused conflict. By the 1950s, seven nations had claimed overlapping slices of Antarctica like a bizarre territorial pie chart. Tensions were rising. Military installations were being considered. The Cold War could have extended to the frozen south.
Instead, twelve nations signed the Antarctic Treaty in 1959, essentially agreeing to freeze all territorial claims and dedicate the continent to peaceful scientific research. The maps remained, but they lost legal meaning. Antarctica became the only continent without military presence or resource exploitation.
This treaty map represents something unusual – nations choosing cooperation over competition. It’s far from perfect, and some worry about what happens when the treaty expires or becomes inconvenient. But for now, it stands as proof that maps don’t have to redraw history violently.
Modern Digital Maps Shape Reality in Real Time
Today’s maps aren’t static documents locked in treaties. They’re dynamic, constantly updating, and they influence billions of decisions daily. Google Maps decides which neighborhoods appear prominent and which seem to disappear. GPS routing affects which businesses thrive and which ones struggle from lack of foot traffic.
Even more significantly, digital maps reflect and enforce geopolitical positions. Google shows different borders depending on where you’re accessing their maps from. Crimea appears as part of Russia if you’re browsing from Russia, but disputed territory if you’re viewing from the United States. Kashmir’s borders change based on your location.
These aren’t neutral, objective representations of reality. They’re political statements, just as powerful as any treaty map from centuries past. The difference is they update instantly and affect how billions of people understand territorial disputes.
Digital maps also create new forms of inequality. Areas with poor mapping data get overlooked for infrastructure development and emergency services. Being absent from digital maps increasingly means being absent from the modern economy.
Looking Forward
Maps have always been about power – who gets to draw them, whose perspective they reflect, and whose interests they serve. The most consequential maps in history weren’t created by the people who had to live with their consequences. They were drawn in distant capitals by men who would never experience the borders they created.
We can’t undo the past, but we can learn from it. As new mapping challenges emerge – from melting ice caps changing maritime borders to satellite imagery revealing previously unknown territories – the question remains: who gets to decide how we divide and define our world? The maps that redrew history teach us that these decisions have consequences that echo for centuries.
Maybe the real lesson is this: every line on a map represents real people, real communities, and real lives. The maps that caused the most damage were the ones drawn without that consideration. So what do you think – are we any wiser about mapmaking today than we were a century ago?


