Every time a checkout screen spins around to face you, a quiet psychological negotiation begins. You didn’t plan to tip. You hadn’t thought about it. Yet something in that moment – the waiting eyes, the glowing numbers, the social weight of the room – pushes you toward the highest button. Tipping, it turns out, has very little to do with math and a great deal to do with how the brain handles pressure, identity, and social belonging. It’s a behavior economists struggle to explain rationally. People tip at restaurants they’ll never revisit. They tip after completing a task themselves. They tip because a number on a screen told them what’s “normal.” Understanding why we give more under specific conditions means understanding some of the most well-documented – and frequently exploited – quirks of human psychology.
The Scale of the Habit: Where Tipping Stands Today

Tipping in America is both widespread and deeply contested. Around 72 percent of U.S. adults say tipping is expected in more places today than it was five years ago. That shift hasn’t gone unnoticed or uncriticized.
About 63 percent of Americans hold at least one negative view about tipping, which is up from 59 percent the year prior. Yet people keep tipping. Roughly 70 percent of American restaurant-goers always tip sit-down restaurant servers.
The average tip on Square’s digital food and beverage transactions fell to 14.9 percent in Q2 2025, from 15.5 percent in 2023. The decline is real but modest, suggesting that cultural inertia remains strong even as fatigue sets in.
The Anchoring Effect: How Suggested Numbers Shape What We Give

One of the most powerful psychological forces at work in modern tipping is anchoring. Most tip screens start with high percentages like 18, 20, or 25 percent rather than low ones – and behavioral economics shows that people anchor to the first number they see, making higher amounts seem more reasonable.
When screens showed options of 15, 18, and 20 percent, the average tip in one study was 16.2 percent. When screens showed 20, 25, and 30 percent, the average jumped to 21.7 percent, even though most people chose the lowest option in both cases.
A Harvard pilot study found that tip recommendations on paper increased tipping by nearly 24 percent, and adding default options alongside higher anchors increased tipping by over 42 percent. The numbers people see first set the invisible ceiling they negotiate down from – not up from.
Social Observation: Tipping When Someone Is Watching
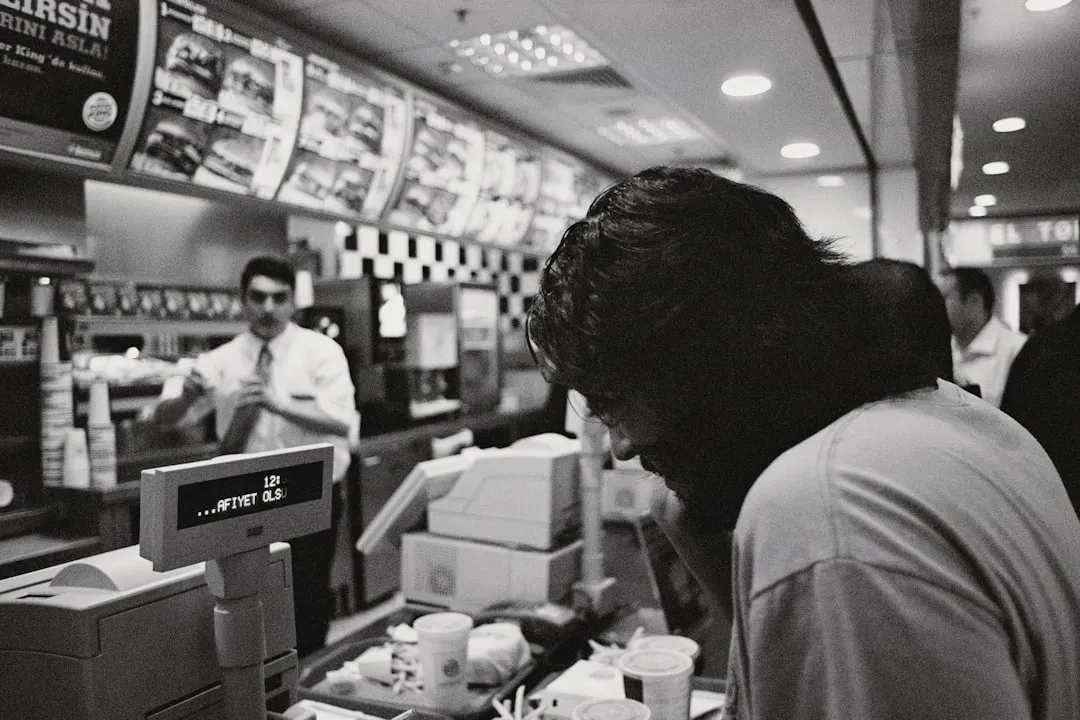
A 2019 study found that when people believe they are being watched, they are significantly more likely to act in socially desirable ways. This “audience effect” shows up with striking regularity at tipping moments.
The physical act of a cashier watching you make a selection creates what psychologists call “social facilitation stress.” You’re not just choosing a tip amount – you’re making a public statement about your values while someone watches.
Being observed triggers reputation awareness. Humans are wired to care about how they’re seen. Even subtle cues – like someone standing nearby – can increase generosity because people want to appear fair and kind. That awareness doesn’t require a direct stare. The mere possibility of being judged is often enough.
Guilt as a Tipping Driver: The Real Cost of Pressure

Guilt is not a minor footnote in tipping psychology – it’s a primary mechanism. A survey of 2,000 people found that the average respondent spends close to $300 a year tipping more than they’d like to due to social pressure, with people reluctantly tipping roughly $24 per month more than they feel is fair.
That annual guilt-tipping figure dropped significantly from 2024’s tally of $453, representing a decrease of about 38 percent year over year. Americans appear to be slowly growing more resistant to pressure-based tipping, though it hasn’t disappeared.
About one in five people surveyed say they always or often tip higher because they feel pressured or guilty. Research published in the Journal of Business Research found that explicit requests to tip actually create psychological reactance, a threat to customer autonomy, which can hamper perceived control when service providers prompt digitally.
Reciprocity Bias: You Received Something, So You Give

Reciprocity is one of the oldest and most reliably documented drivers of human generosity. Reciprocity bias describes our tendency to reciprocate the actions of others. If somebody does something for us or gives us something, we are more likely to return the favor.
In a study at a New York State restaurant, waiters who gave diners a small piece of wrapped chocolate with the bill received an average tip of 17.8 percent, compared to 15.1 percent among those who received nothing. A small gesture produced a measurable financial outcome.
Tip screens often appear after service is complete but before payment is finalized. This timing triggers reciprocity bias, the psychological tendency to return favors. The brain interprets tipping as “paying back” rather than “paying extra.” That framing subtly shifts the emotional weight from voluntary generosity to felt obligation.
Social Norms and Conformity: Doing What Everyone Else Does

A study published in Management Science by researchers at Tel Aviv University found that tipping is driven by two main forces: genuine gratitude for service and social conformity, meaning the pressure to do what everyone else does.
Research analyzing tipping behavior also found that social conformity and self-concept considerations significantly influence tipping, with anticipated social feedback and identity-related reciprocity expectations underpinning tipping decisions.
Results from research on tipping norms support the normative nature of tipping, showing that stronger social tipping norms increased both the likelihood of tipping and, in some cases, the size of tips given. Norms don’t just describe behavior – they prescribe it, often more powerfully than any individual preference.
The Age Divide: Generations Don’t Tip the Same Way

Tipping behavior isn’t uniform across age groups, and the gap is wider than many assume. Only about 43 percent of Gen Z adults always tip at sit-down restaurants, compared to roughly 84 percent of baby boomers.
The likelihood of tipping generally increases with age, with Gen Z and millennials standing out as the least frequent tippers. This isn’t simply about generosity – younger people show a fundamentally different relationship with the norms themselves.
Adults under 30 are more likely than those 65 and older to point to workers’ pre-tip wages, social pressure, and the cost of the tip as major factors when deciding whether to leave a tip. For younger tippers, the decision is more consciously analytical and less reflexive than it is for older generations.
The Warmth Cue: How Personal Interactions Change Tip Size

Service quality matters, but so does the emotional texture of an interaction. Servers who are friendly, attentive, and personal often receive better tips. One reason is emotional reciprocity: when someone treats you kindly, you feel an urge to respond kindly. Even a brief warm interaction can make a tip feel less like a fee and more like a thank-you.
Non-verbal cues and body language also play a meaningful role. A warm smile, maintained eye contact, or a light touch on the shoulder can all contribute to a positive interaction that encourages tipping. These subtle signals can create a sense of warmth that customers often feel compelled to reward.
Studies showed that when a waitress lightly touched a male patron, the average tip was 15 percent, compared to 11 percent in a no-touch condition. The physical and interpersonal environment shapes generosity in ways that have nothing to do with how well the food was cooked.
Bias in Tipping: Race, Gender, and Appearance
Tipping is not a neutral act. The literature on who gets tipped more – and why – reveals uncomfortable patterns. Studies published in the Journal of Applied Social Psychology reveal that tipping behavior reflects racial and gender biases. Female servers may tolerate inappropriate behavior to avoid losing tips, and more attractive servers of both sexes may receive greater tips.
A Cornell University study found that customers tend to tip servers of their own ethnicity more generously. This in-group favoritism operates largely below conscious awareness, which makes it especially persistent.
External shocks can also significantly impact tipping behavior. Variables like monthly income, client gender, job loss, and even religious beliefs notably affect the amount people tip. Tipping, in this light, reflects the social structure of the tipper at least as much as it reflects the quality of service received.
Tip Fatigue and the Limits of Psychological Pressure

Every psychological lever has a breaking point. The data from 2024 and 2025 suggests that Americans are reaching theirs. Yelp reviews mentioning “tipflation” increased nearly 400 percent between May 2023 and April 2024.
In 2025, respondents guilt-tipped an average of 4.2 times per month, compared to 6.3 times in 2024 research findings. The frequency of socially coerced giving is measurably declining, even as tip prompts appear in more places than ever.
Customers are willing to tip generously for full service and exceptional experiences, but they are rebelling against tip prompts where minimal service is provided. A Horizon Media survey found that 81 percent of consumers preferred the status quo of voluntary tipping. There’s a meaningful distinction between choosing to be generous and being engineered into it – and more people appear to be drawing that line.
Conclusion

What makes tipping psychology so compelling is that it reveals just how social and context-dependent generosity really is. People don’t tip based on a clean internal calculation. They tip because of what the screen suggests, who’s watching, what they received, and what the room seems to expect.
That’s not a flaw in human thinking – it reflects how deeply wired we are for social coordination. The problem arises when that wiring gets deliberately triggered in situations where it doesn’t belong. Tipping someone for carrying your bag is one thing. Being prompted for 25 percent after scanning your own groceries is another.
Understanding these cues doesn’t make them disappear, but it does shift something important: the moment you recognize the mechanism, the choice becomes more genuinely yours. And in a landscape designed to nudge you in one direction, that clarity is worth more than any preset option on a screen.