

Most people searching for a home in 2026 start with the obvious. They Google the familiar cities, scroll through the same overpriced listings, and wonder why they can’t catch a break. What they miss are the ZIP codes quietly sitting just off the radar, places where real value is still real, and homeownership isn’t just a dream for the ultra-wealthy. These are not ghost towns or struggling rust-belt afterthoughts. They’re actual communities with jobs, schools, and a genuine quality of life.
Notably, none of the top-ranked ZIP codes for projected appreciation are located in the nation’s largest or most expensive housing markets. Instead, some of the strongest home price growth projected for 2026 is happening in places that rarely make “hot market” lists, smaller and more affordable ZIP codes where supply remains tight. Honestly, that tells you everything you need to know about where the smart money is going. Let’s dive in.
The National Affordability Crisis Nobody Fully Appreciates Yet

Before we get to the hidden gems, let’s be real about what “the 215” and other legacy real estate markets have become. In 2025, the average age of a first-time home buyer hit a record high of 40, a sharp increase from 33 just five years earlier. In 1980, the average age of first-time homebuyers was around 29. That’s a generational shift happening right in front of us, and most people aren’t connecting the dots.
Median home prices in the U.S. have ballooned by nearly 160% since 2000. To put that into a human frame, think of what a dollar could buy you at the start of the millennium versus today. Now apply that same math to your mortgage payment. Buying a home in much of America now requires a six-figure salary. In several major cities, it takes more than $200,000 a year.
Analysis revealed that only 3 out of 150 major ZIP codes had a mortgage-to-income ratio below the 28% threshold, which is the guideline banks use to define affordability. Three. Out of one hundred and fifty. The search for value has never been more urgent.
Pittsburgh’s 15228: A Suburb That Quietly Delivers
Pittsburgh’s 15228 ZIP code ranked as one of the most affordable in Pennsylvania for renters relative to income. What makes this area fascinating is the combination of old neighborhood character and genuinely livable numbers. The area has 18,110 residents and households with a median income of $123,681 and a home value around $383,700.
Pittsburgh requires only $64,106 in annual salary to afford a median-priced home, one of the lowest income thresholds among the 50 cities analyzed. Compare that to, say, San Jose where the number approaches half a million. In Pittsburgh, a new buyer would face a principal and interest payment only 32.5% higher than the typical existing mortgage holder, compared to the national average where the payment gap is 73.2%.
In this ZIP code, nearly 70% of adults aged 25 and up hold a bachelor’s degree or higher, far above the national rate of about 36%. That education profile drives a stable, upwardly mobile community that sustains property values over time. Here’s the thing, a well-educated neighborhood that’s still affordable is the rarest unicorn in American real estate.
Rochester, New York: The Northeast’s Best-Kept Secret
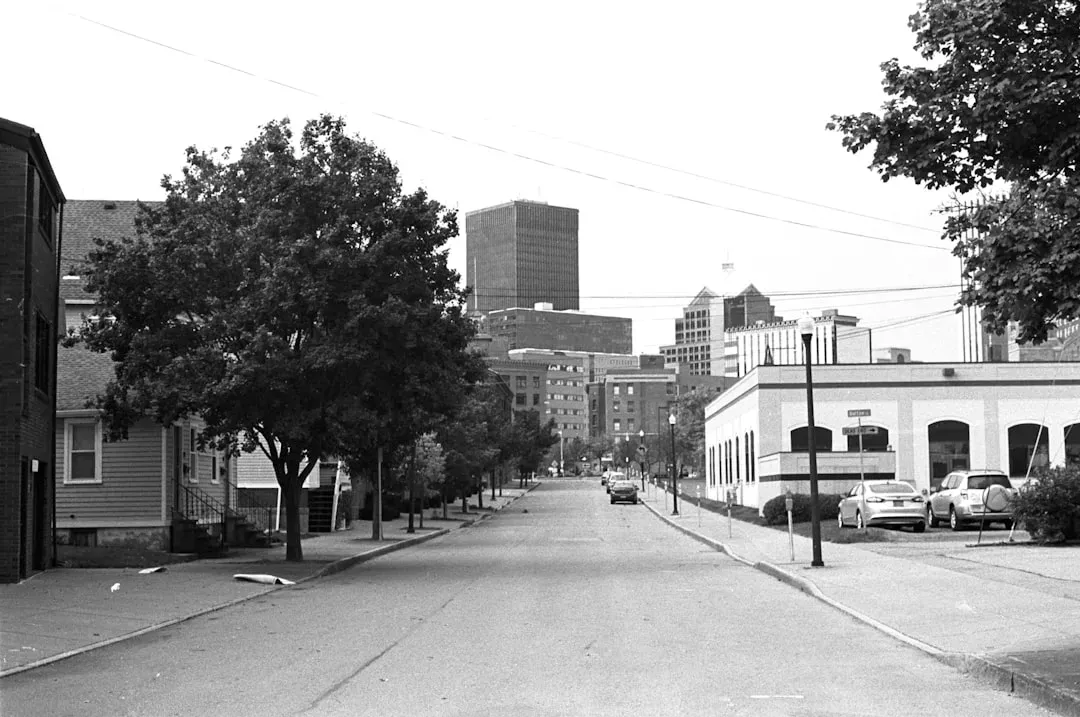
Rochester, New York has been ranked the number two top U.S. housing market by Realtor.com, with a forecast of 5.3% home sales growth and a 10.3% median sale price increase, making it an attractive and affordable option for buyers. That combination of appreciation and relative affordability is extraordinarily rare in the Northeast.
Rochester’s west-side neighborhoods are set for notable home price gains over the next year. The area is becoming a hotspot for growth through 2026, attracting buyers with a mix of affordable housing and strong local employment in healthcare and tech. I think of it like discovering a restaurant before it gets written up in a magazine. Once the review lands, prices go up.
Look at Rochester, NY specifically. The price premium for a new build compared to an existing house there is 137%, while nationally that premium is only 10.2%. This stark contrast shows that builders simply aren’t filling the supply gap, forcing strong demand for existing homes and fueling the price growth expected in 2026.
Springfield, Ohio: Industrial Backbone, Bargain Prices

Stevens Point, Wisconsin, and Springfield, Ohio rank as the nation’s top appreciation hotspots, each projected to jump nearly 11% over the next 12 months, outpacing many larger and more expensive markets. For buyers willing to look past the headline cities, this is genuinely jaw-dropping data.
Springfield’s housing momentum reflects the broader resurgence of western Ohio. Industrial expansion and logistics investment are reshaping the area’s economy, while the nearby Wright-Patterson Air Force Base provides employment opportunities and supports local businesses. That’s a real economic engine, not hype.
Limited listings and migration from Dayton and Columbus suburbs are further amplifying price pressure. Think of Springfield as a compressed spring. The demand is building, the supply is tight, and the moment it releases, buyers who got in early win. It’s hard to say for sure how long the window stays open, but data from late 2025 suggests it’s still accessible in 2026.
Rockford, Illinois: Chicago’s Bargain Overflow Market
Mid-sized and often overlooked regions like Rockford, Illinois are projected to see roughly 10.5% price growth, highlighting a shift toward more affordable regional hubs. Rockford is essentially the pressure valve for Chicago. When prices push workers out of the metro, Rockford absorbs them.
Rockford’s affordability advantage is attracting new residents and investors from the Chicago metro area. It’s not glamorous, and Rockford has had its challenges, but for a buyer looking at pure value math, the fundamentals are increasingly compelling. A modest commute to Chicago positions buyers in a price bracket that doesn’t exist closer to the city.
Based on analysis from Realtor.com, the top housing markets poised for strong sales and price rises in 2026 are overwhelmingly concentrated in the Northeast and Midwest, led by value hubs where chronic low inventory meets a surge of affordability-seeking buyers from expensive East Coast cities. Rockford fits that pattern like a glove.
Hartford, Connecticut and Its Suburbs: The Spillover Effect in Action

Connecticut, especially Hartford and its suburbs, stands out among the top performers, benefiting from spillover demand from higher-cost neighboring states. When New York and Boston become financially untenable for working professionals, they look north and west, and Hartford is exactly what they find.
Syracuse, NY, and Hartford, CT, are forecast to see roughly 5% appreciation, suggesting a shift in demand toward lower-cost, historically stable housing markets. Five percent appreciation in a stable market is, honestly, about as good as it gets without taking on excessive risk. Slow and steady rarely makes headlines, but it builds wealth reliably.
Even in Connecticut, one of the wealthiest states in the country, certain ZIP codes like South Windsor’s 06074 show homes priced at roughly three times the local median annual salary, a ratio that would make buyers in San Francisco weep with envy. The state’s reputation for high costs obscures these genuine pockets of value.
Birmingham, Alabama and Akron, Ohio: The Most Affordable Hidden Gems by Raw Price

Among the most affordable hidden gem cities analyzed, Birmingham, Alabama leads with an average home price of $133,463, followed closely by Akron, Ohio at $134,104. Those are not typos. Those are real numbers in real American cities with real infrastructure, jobs, and communities in 2026.
A composite analysis of 44 U.S. cities ranked 101 through 202 by population was conducted to identify potential hidden housing gems that strike a balance between affordability, safety, and market dynamics. This is rigorous research, not wishful thinking. Birmingham and Akron emerged as the top value-price performers.
Toledo, Ohio also deserves a mention in this bracket. Toledo’s price growth projection is massive at 13.1%, and the median list price near $199,900 means that even minor competition dramatically boosts the percentage appreciation. Toledo is a pure affordability play.
Leawood, Kansas (66224): Where Renters Can Actually Breathe

The average rent in Leawood’s 66224 ZIP code in Kansas costs just 10.57% of the local average income, making it the most affordable rent level of any ZIP code in the country. Let that sink in. One tenth of income going to rent is something virtually unimaginable in most American cities right now.
The 66224 ZIP code is right at the border of Kansas and Missouri, and just a couple of ZIP codes south of Leawood 66211, home to Kansas’ priciest residential real estate. The geography is almost ironic. The most affordable ZIP code in the nation sits right next door to one of the most expensive in its state. The value gap between adjacent codes can be staggering.
This is the kind of market dynamic that rewards buyers who zoom into the data instead of relying on city-level generalizations. The difference between a good ZIP and a bad deal can literally be a few blocks and a five-digit number.
The 08610 Trap: ZIP Codes That Are Affordable Now But Won’t Be Tomorrow

Here’s the urgent side of this story that most buyer guides gloss over. Some ZIP codes are currently priced as hidden gems but are quietly running out of time. With a one-year projected growth rate of 4.2%, it may take only until 2026 for home values in Trenton, New Jersey’s 08610 to rise above the national median.
While many ZIP codes across the country still have houses available well under the national median, they likely won’t stay that way for long. Several once-affordable areas are projected to have soaring housing prices, becoming unaffordable within the decade. If you were thinking about waiting, you might want to consider buying now before prices skyrocket.
The window is not indefinitely open. Markets like Erie, Pennsylvania, which stands out with a forecasted increase of more than 10%, highlighting renewed interest in affordable waterfront metros not typically associated with rapid appreciation, illustrate how quickly a hidden gem can stop being hidden once the data goes mainstream.
What the Best-Value ZIP Codes of 2026 Actually Have in Common
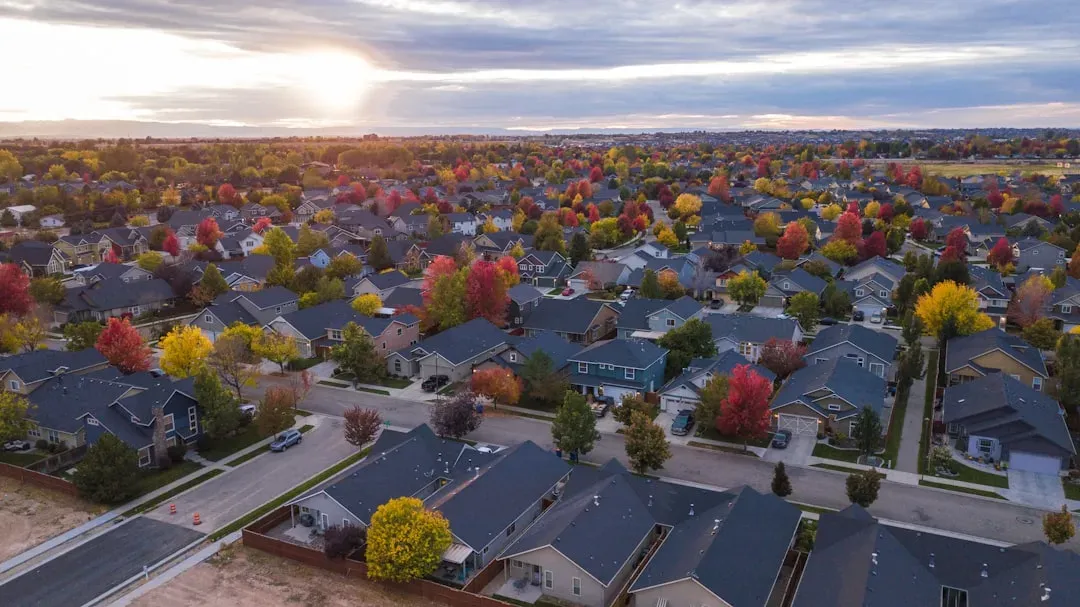
The top-performing markets are attracting attention with a compelling mix of lifestyle appeal, relative affordability, and strong ties to nearby economic hubs. That pattern repeats across every ZIP code worth serious attention right now. None of them exist in a vacuum. They’re orbit plays, communities inside the gravity well of larger metros.
Most housing experts expect moderate national price growth in 2026, paired with significant variation at the local level. The biggest gains are unlikely to be evenly distributed. Instead, appreciation is expected to favor markets with strong economic fundamentals, limited housing supply, and sustained demand. The ZIP code matters more than ever before.
For first-time homebuyers, remote workers, and families seeking more for their money, smaller U.S. cities are becoming increasingly attractive. The shift is real and measurable. From a national perspective, a moderate increase in prices of roughly 3% year-over-year is expected, but price growth will vary by region, with the strongest growth expected in the Midwest and New England. The hidden ZIP codes are no longer a niche idea. They’re where the 2026 housing story is actually being written.
What do you think? Would you relocate to a “hidden gem” ZIP code for better value, or is location still your non-negotiable? Let us know in the comments.


