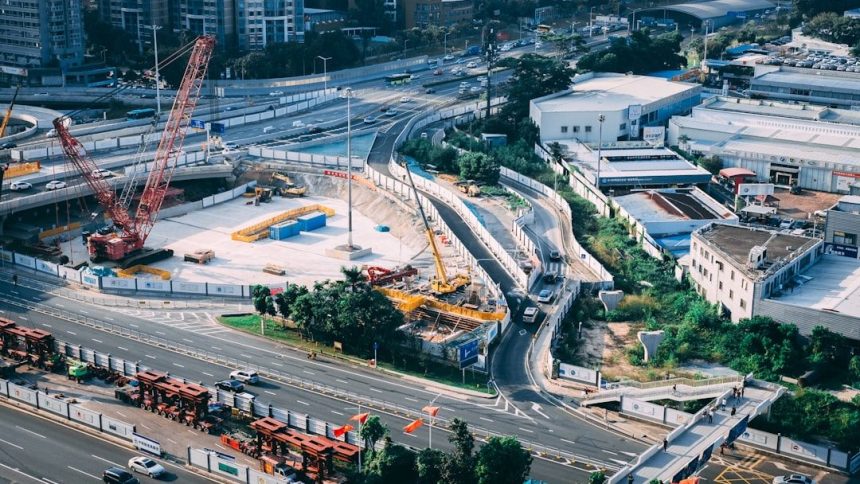
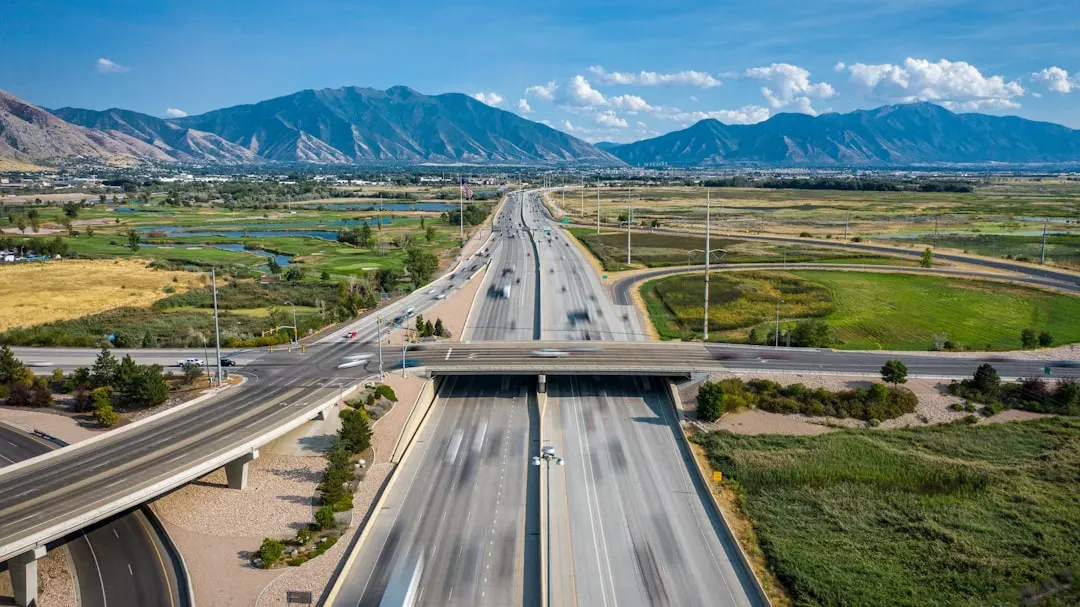
There is something deeply unsettling about watching a Dutch construction crew build an entire highway overpass over a single weekend while Americans debate the environmental paperwork for a two-mile road extension that has been in limbo since 2019. It feels almost fictional. Yet this is the reality of infrastructure in the United States in 2026, a country that once built its legendary Interstate Highway System and now struggles to add a lane to an existing one.
The gap between America and the rest of the world when it comes to highway construction speed is staggering. It is not a minor difference. It is systemic, layered, and surprisingly hard to fix. Buckle up, because what follows is a journey through the bureaucratic, financial, and political jungle that turns simple asphalt into a decade-long ordeal.
A Price Tag That Defies Logic

Let’s be real: when you hear that the U.S. is spending three times more per mile on road construction than comparable countries, your first instinct might be to assume America is just building better roads. That instinct is wrong. Building infrastructure in the U.S. costs substantially more than in other countries – on a per-mile basis, the U.S. spends three times as much as other upper- and middle-income countries on certain transportation infrastructure.
State and local governments expended $266 billion on highways alone in 2022, and on a per-project basis, that spending is over three times as high as other upper- and middle-income countries, according to university researchers. Think about that for a moment. The same mile of road that costs a dollar to build in Germany or South Korea costs three dollars to build here. The money is flowing somewhere. It just is not flowing into more efficient construction.
A 2019 paper by Leah Brooks of George Washington University and Zachary D. Liscow of Yale University documented a striking fact: real spending per mile on Interstate construction increased more than threefold from the 1960s to the 1980s. That trajectory never really reversed. It only accelerated.
The Staffing Crisis Nobody Talks About

Here is something that rarely makes headlines: the people who are supposed to manage these road projects have been quietly disappearing for two decades. Researchers found that better staffed DOTs build roads more cheaply. There has been a “striking decrease in state DOT employment over the last 20 years, especially in the wake of the Great Recession,” and one result of this situation is an increased reliance on consultants when building projects, which is correlated with higher costs.
Survey respondents widely agreed that DOTs have become understaffed over time and that reliance on consultants drives up costs. A one standard deviation increase in state capacity (measured by state DOT employment per capita) is correlated with sixteen percent lower costs. That is not a small number. That is the difference between a project finishing on time and one dragging on for years.
Researchers who collected data on individual DOT engineers in California found that a substantial amount of variation in the cost of a resurfacing project can be explained by which engineer is assigned to it. Specifically, replacing a construction engineer at the 95th percentile of the cost distribution with a median engineer would reduce costs by 5.3% on average: $24,000 per mile, or $220,000 per average project. The talent and staffing problem is real, measurable, and expensive.
The NEPA Maze: When Environmental Review Becomes an Endless Tunnel


The National Environmental Policy Act, signed in 1970, was meant to ensure that big infrastructure projects did not silently bulldoze ecosystems and communities. Honestly, that is a worthy goal. But somewhere along the way, the process evolved into something far more labyrinthine. A Department of Transportation report indicates that its recent environmental assessments took an average of 9.6 months. Environmental impact statements take much longer, with the most recent government study showing that the median time to complete one is 2.8 years. Since agencies have to complete their NEPA reviews before making final decisions, the time to complete these reviews typically drives permitting timelines.
The median time for NEPA reviews in which a final decision was issued in 2024 was 26 months. That is more than two years just to get the environmental stamp of approval – before a single piece of machinery moves. Meanwhile, European countries conduct their own environmental reviews in a fraction of that time and still manage to protect natural habitats effectively.
Agencies’ compliance with NEPA can also be the subject of lawsuits – approximately 100 to 150 NEPA cases are filed each year – and when courts order agencies to do more analysis, it can dramatically slow permitting timelines. In practice, this means that any organized opposition group can weaponize the legal system to delay a project indefinitely, even if the project ultimately gets built.
The ‘Citizen Voice’ Effect: Democracy’s Double-Edged Sword

There is a fascinating and uncomfortable irony buried in the research on highway costs. The very tools that gave communities a voice in infrastructure decisions are also partly responsible for the ballooning timelines and price tags. Brooks and Liscow pinpoint the early 1970s as the inflection point for increased spending on highway projects, around the time the National Environmental Policy Act (NEPA), which requires environmental impact review for federally funded projects, was passed in 1970.
Statistically, changes in income and housing prices explain about half of the increase in costs per mile, with suggestive evidence that the rise of “citizen voice” in government decision-making increased spending per mile. Wealthier communities, in particular, proved far more effective at using legal and regulatory tools to delay, reroute, or kill highway projects that threatened their neighborhoods. It is a bit like every neighborhood becoming a master chess player at blocking the board.
One key finding from researchers is that if a given community is wealthier, the state will wind up spending more to build a given mile of Interstate. This effect increased over time. The result is that the highway map in America is partly drawn by who has the loudest legal team.
How the Interstate Was Born – and Why It Took 35 Years

The initial cost estimate for the Interstate Highway System was $25 billion over 12 years; it ended up costing $114 billion (equivalent to $634 billion in 2024) and took 35 years. This is not ancient history. It is a preview of how the U.S. builds things. The project that was supposed to be a twelve-year sprint became a multi-generational marathon.
The original Interstate took 35 years to complete, and two of the original Interstates – I-95 and I-70 – were not even continuous: both discontinuities were due to local opposition, which blocked efforts to build the necessary connections to fully complete the system. I-70 remains incomplete to this day in a meaningful sense. The lesson here is that opposition to road-building is not new. What changed is how organized and legally empowered that opposition became.
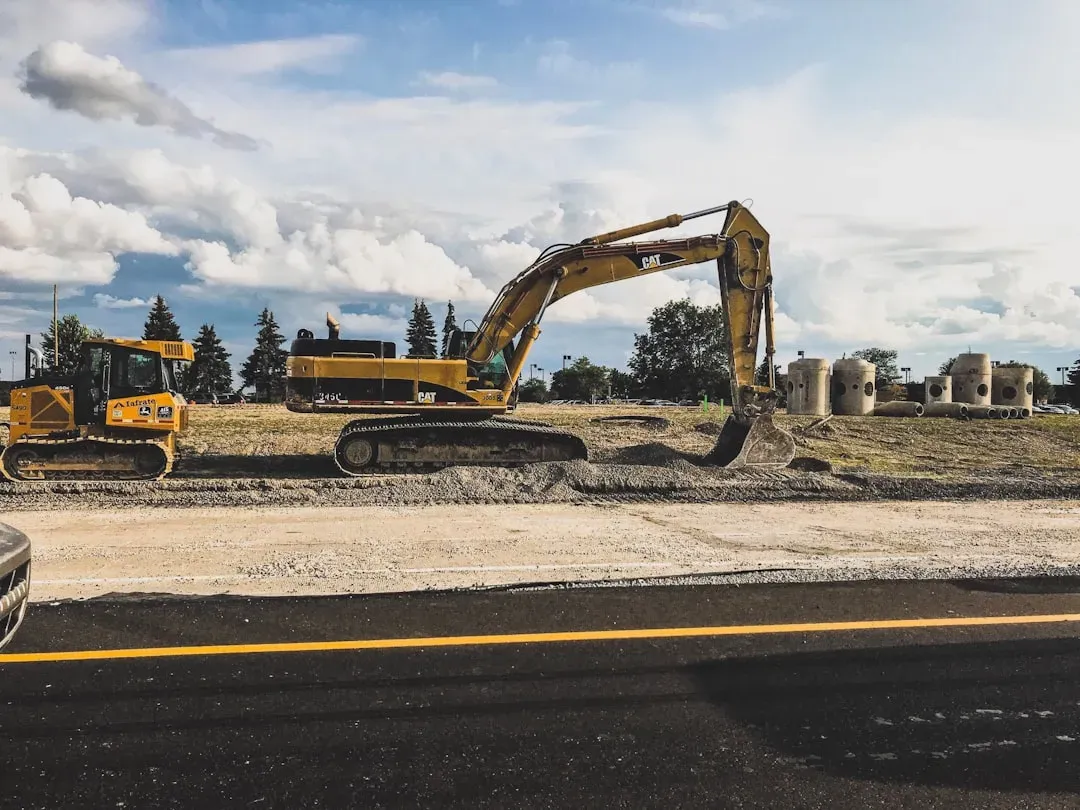
Since the enactment of the 2021 Infrastructure Investment and Jobs Act, construction work has started on 207,000 miles of roadways. Starting construction is one thing. Finishing it within a sane timeline is another matter entirely.
America vs. China: A Jaw-Dropping Construction Race
If you want a clear picture of the construction gap, look at China. China’s expressway (superhighway) network grew from 65,055 kilometers in 2009 to 177,300 kilometers in 2022 – the Chinese highway system almost tripled in size in 12 years. In contrast, it took 36 years, from 1956 to 1992, to build America’s Interstate highway system. That is a stunning contrast. China built roughly a century’s worth of American construction ambition in barely a decade.
The next 9,500 miles of American roadway took 20 years to complete, with another five years for finishing touches on the entire system. In contrast, China added 7,000 miles of expressway in 2011 alone. Think of that scale for a moment. In one year, China built nearly as much expressway as America added in a generation.
It would be tempting to say China can do this because it is an authoritarian state that simply bulldozes over opposition. That is part of the picture, but not all of it. The second part of China’s strategy was public-private partnerships. While China had plenty of talented engineers and construction workers, they didn’t necessarily have the expertise to finance, manage and build expressways at the scale necessary, so foreign companies played a key role. Structural finance and project management innovation, not just political will, drove the speed.
The Contractor Competition Problem

Here is a detail that gets buried under all the talk about environmental reviews and political gridlock: the market for highway construction in the U.S. is not particularly competitive. Researchers found that a lack of DOT staff capacity and a dearth of contractor competition in the market are key drivers of high project costs. When only a handful of qualified companies can realistically bid on a major highway project, those companies have enormous pricing power.
The cost of construction is tied to the relative lack of competition at all levels of construction, from Construction Managers to subcontractors. The work is so relatively rare and specialized, and the specifications are so detailed, that the same participants show up every time. It is essentially a closed market dressed up in the language of open bidding. The same contractors, the same consultants, the same inflated price structures, cycle after cycle.
Simply put, the researchers found better staffed DOTs build roads more cheaply. More state capacity means the government can push back harder on contractor pricing, evaluate bids more rigorously, and manage projects with greater accountability. Without that capacity, the contractors set the terms.
The Funding Gap That Just Keeps Growing

Even with record spending commitments, America is still falling further behind. According to ASCE’s Bridging the Gap report, surface transportation needs from 2024 to 2033 total about $3.5 trillion, of which $2.2 trillion represents the nation’s roadway system. If funding levels included in the Infrastructure Investment and Jobs Act become the new baseline for annual investment, the nation’s roadways will still have a funding gap of $684 billion over the next 10 years.
With the 2025 Report Card for America’s Infrastructure, ASCE estimates investment needs total $9.1 trillion for all 18 Report Card categories to reach a state of good repair. That number is so large it has lost meaning for most people. It is the kind of figure that gets cited in congressional hearings and then quietly set aside.
The typical U.S. driver lost 43 hours to traffic congestion and $771 worth of time in 2024, up from 42 hours and $733 in 2023. These amounts of time lost are equivalent to spending one work week per year sitting in traffic. The funding gap is not just a number in a spreadsheet. It is a week of your life, every single year.
The Reform Efforts: Real Progress or Just Paper?
In fairness, there have been genuine attempts to speed things up. The Trump administration, starting in early 2025, made NEPA reform a central priority. The U.S. Department of Transportation, the Army Corps of Engineers, and the Department of the Interior each finalized significant changes to simplify environmental review. DOT’s statement declared that these changes will “slash red tape, accelerate major infrastructure projects, minimize delays, and curb soaring compliance costs,” aiming to ignite a “golden age of transportation.”
The Biden administration had taken initial steps toward streamlining in 2024, and the Trump administration appears to be running with it in 2025. It is not yet apparent whether this is having an effect, but this kind of systemic reform could make a real difference over time. The honest answer is that it is simply too early to tell if the regulatory changes will translate into actual shovels in the ground faster.
NEPA litigation rarely changes outcomes, but it does often delay or kill projects. A July 2025 Breakthrough Institute study found federal agencies win roughly three-quarters of NEPA cases. However, by repeatedly filing lawsuits, project opponents aim to delay the process until developers run out of funding and abandon their projects. Reform on paper and reform in practice are very different things in America’s legal ecosystem.
What the Road Ahead Actually Looks Like
I think the frustrating truth here is that there is no single villain in this story. It is not just the lawyers, or the underfunded DOTs, or the nimby neighbors, or the political gridlock in Congress. All of these forces are real, and they all compound each other in ways that are genuinely difficult to untangle. The U.S.’s failure to build quality infrastructure at reasonable speed and reasonable cost is a big reason why the country “can’t have nice things” – and may also prevent the U.S. from transitioning to clean energy production.
The Infrastructure Investment and Jobs Act contained a five-year reauthorization of federal surface transportation programs for Fiscal Years 2022 through 2026, including $273.2 billion over five years in formula funding for states, representing a nearly fifty percent increase in highway funding from the previous surface transportation reauthorization. Money is flowing. The question remains whether the systemic machinery can absorb it fast enough to matter.
The gap between the speed at which America dreams of great infrastructure and the speed at which it actually builds it is not just an engineering problem. It is a reflection of a society that has layered so many legitimate competing interests on top of each other that forward motion has become almost structurally impossible. The Dutch built that overpass in a weekend. The question America needs to honestly answer is whether it actually wants to learn how. What do you think – is the problem fixable, or is it baked into how the U.S. system works? Tell us in the comments.