


Every week, a handful of ranked decide which books get called bestsellers. Those shape bookstore displays, publisher marketing and the blurbs printed on future covers. Few readers know how the rankings are built.
The short version is that nobody simply counts every book sold in America. Each list relies on sampled or reported sales data, plus rules about categories and formats. The details differ from list to list, and some of them are kept private.
A List That Began in One City

The New York Times Book Review has published its list weekly since October 12, 1931. The first edition covered books sold in New York City only. It was a modest start for what became a national benchmark.
Over time the format changed. City lists were eventually dropped, leaving a national ranking built from reports by leading booksellers in 22 cities. In the 21st century it grew into multiple lists grouped by genre and format, including fiction, nonfiction, hardcover, paperback and e-books.
Why the Times Keeps Its Method Private

The Times list rests on a proprietary method that uses sales figures, other data and unpublished internal guidelines. That secrecy has long been a source of frustration for authors. They keep speculating about where the data comes from, how it is weighted and who crunches the numbers.
What the paper does say publicly is fairly general. Its standard statement describes a weekly survey of tens of thousands of bookstores. The identities of those stores are a guarded secret.
Statistical Weighting and the Critics
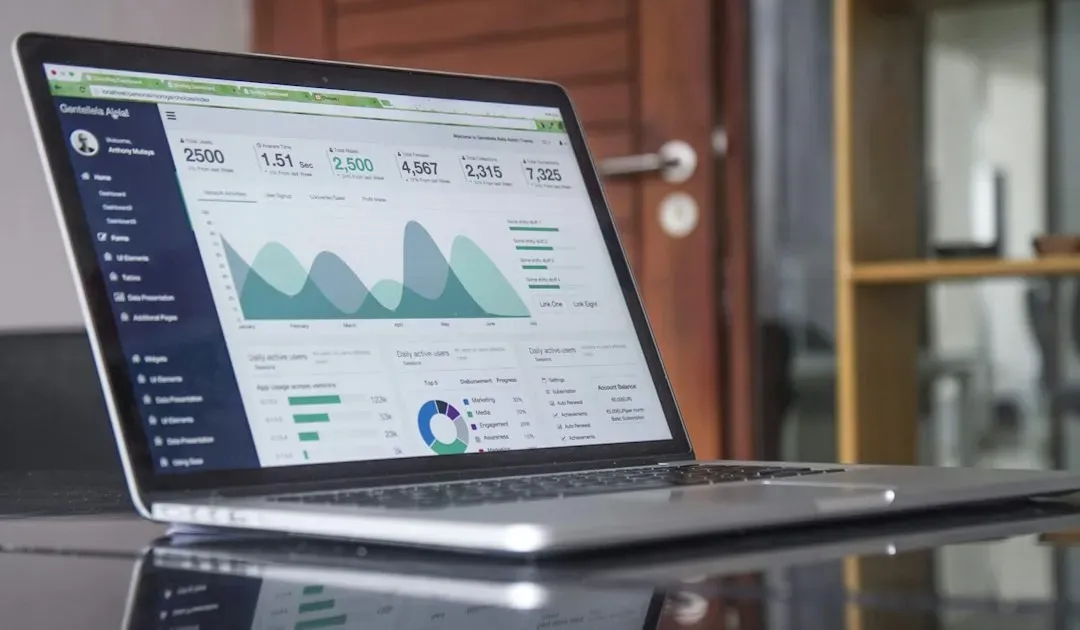
The Times describes its lists as weighted. Its methodology page says sales are statistically weighted to reflect all outlets proportionally nationwide. In other words, a raw count of copies from a reporting store isn’t the final number.
Not everyone accepts that claim. Novelist James Patterson publicly questioned whether the process has real statistical rigor. The Times responded that it takes such concerns seriously and keeps reviewing its methods.
BookScan Supplies the Industry’s Sales Data

Much of the wider industry works from a different source, Circana BookScan. It offers point of sale tracking covering approximately 85% of trade print books sold in the U.S. That means data comes from cash registers and online checkouts, not estimates.
The service is relatively young. Nielsen BookScan launched in January 2001. Before that, tracking such as the Times list was done without raw numbers. It took the name Circana BookScan in March 2023.
What BookScan Leaves Out

Coverage is broad, though not total. BookScan can’t accept reporting from ecommerce-only, pop-up, mobile or used stores. Independent bookstores must report through the American Booksellers Association to be included.
Partner offer
Digital formats are a separate story. Circana’s PubTrack Digital reports e-book sales supplied by more than 450 participating publishers. It reports monthly, not weekly, with results posted two months after each sales month. That delay is one reason print figures tend to dominate headlines.
How the Times Splits Its Lists

The Times doesn’t publish one ranking. At the time of that report, there were 11 weekly lists and seven monthly lists. The weekly lists sort books into fiction, nonfiction and children’s books, with fiction and nonfiction split further into hardcover, paperback and combined print and digital.
Timing follows a set rhythm too. New lists go live online on Wednesdays at 7 p.m. EST. Part of each list appears in print 11 days later, because of the newspaper’s printing schedule.
USA Today and Its Single Ranking

USA Today takes a blunter approach. Its list combines chain, independent and online sales into one ranking of the past week’s 150 top-selling books. Fiction, nonfiction, children’s titles and e-books compete in the same table.
The list also had a gap in its history. The paper suspended it in December 2022. When it returned, USA Today said it ranks the 150 top sellers weekly based exclusively on sales analysis from U.S. booksellers. The rankings are aggregated from sales data without editorial subjectivity.
Publishers Weekly and the Trade View

Publishers Weekly serves people inside the business. After 2012 it used Nielsen BookScan lists for print, supplemented by Amazon lists for Kindle and print. That mix reflects how hard it is to capture every format from a single source.
Its lists cover more than one slice of the market. Categories are divided by format, age group and genre. The trade focus also means it is usually quoted more by agents and editors than by casual readers.
Why Lists Disagree and Get Gamed

Different data sources and rules produce different rankings. A self published author whose sales are mostly e-books can be strong on one list and absent from another. One analysis of USA Today’s list noted that self published romance authors were mainstays there until a change in the list.
Bulk buying is the other recurring issue. NPR’s Planet Money looked in 2026 at how people have tried to game their way onto the Times list. Some marketing guides claim the Times scrutinizes bulk buys and may exclude or flag them, though that comes from a consultant’s blog and not an official Times statement.
The Market These Lists Measure

The scale behind the rankings is large. Print unit sales at BookScan outlets reached 762.4 million in 2025. That was a 0.3% rise over 2024, which had grown 0.5% over 2023.
The top of the 2025 chart was clear. The Let Them Theory by Mel Robbins sold more than 2.8 million copies, making it the bestselling book of the year at BookScan outlets. In 2026, print unit sales slipped 0.3% in the first six months, for the period ended July 4. Strong adult fiction offset weakness in adult nonfiction.
Partner offer
Planning a trip to Vegas?
Compare hotel rates and show tickets on VEGAS.com.