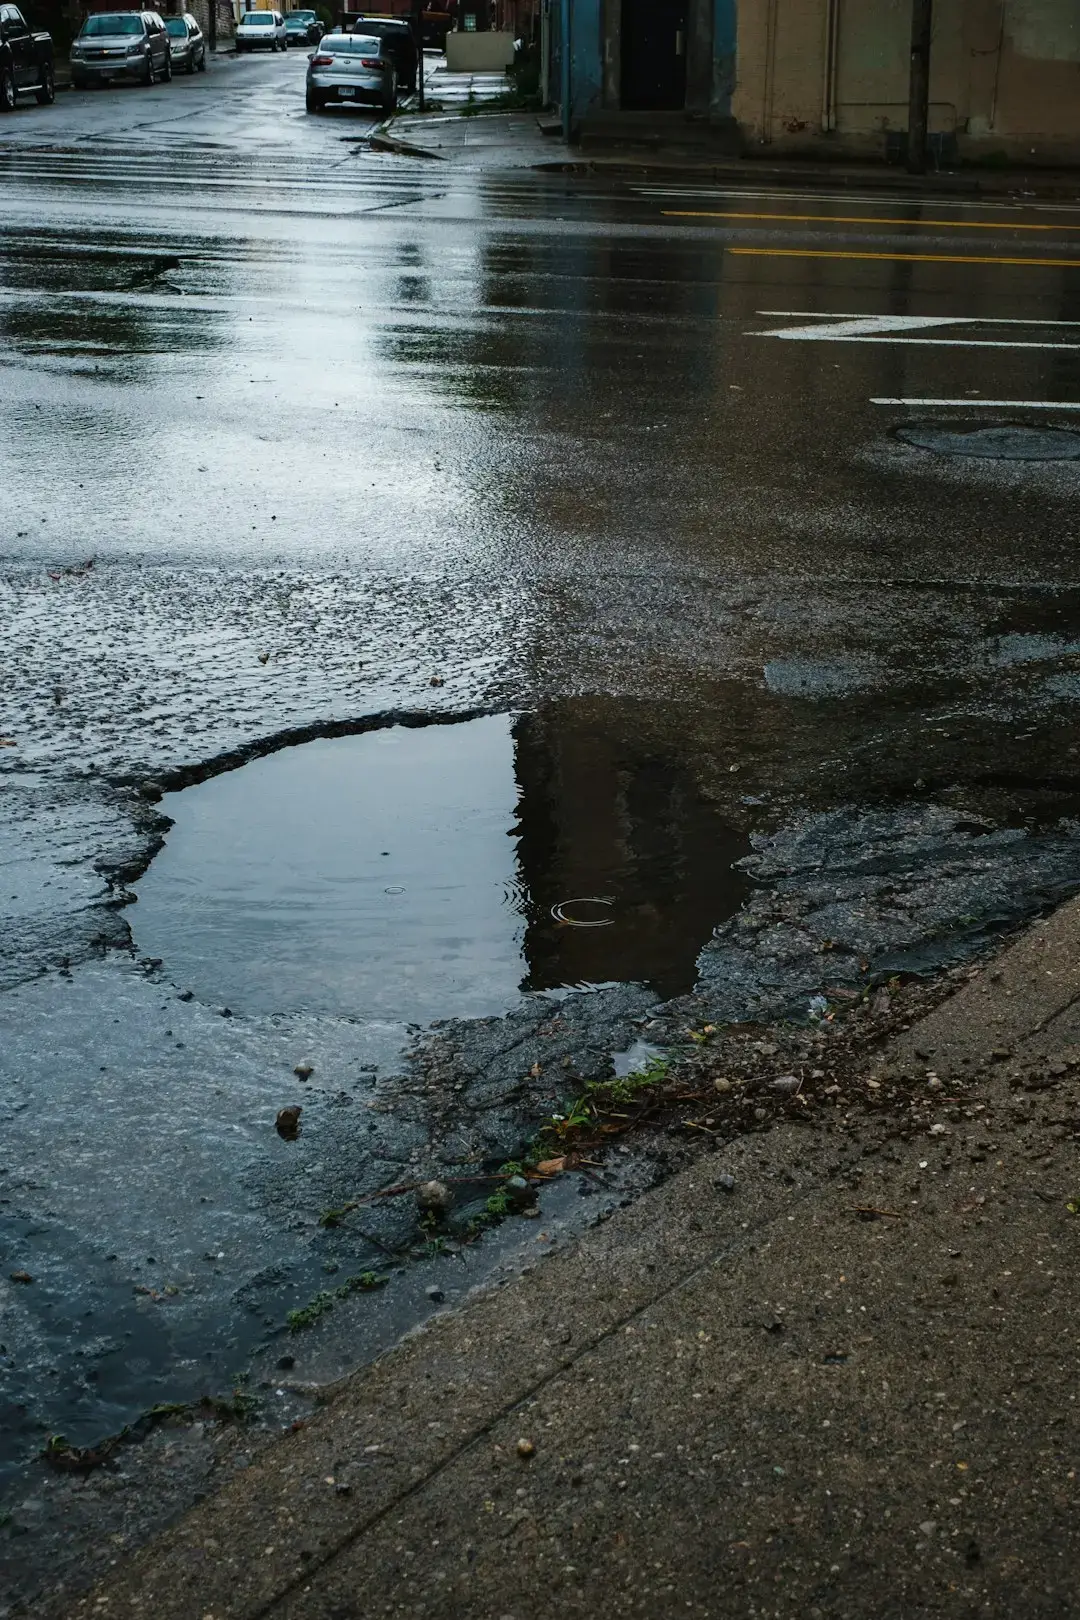
There is something deeply personal about hitting a pothole. That sudden, teeth-rattling jolt. The brief panic as you check your steering wheel. The sinking feeling when you hear something clunk under the car. It is a shared national experience, felt equally by commuters in Chicago, residents of rural Vermont, and city dwellers in Los Angeles. Potholes are everywhere, and honestly, they are getting worse before they get better.
What is really going on beneath the surface of America’s roads, and which cities and districts are actually making meaningful progress? The answers might surprise you. Let’s dive in.
America’s Roads Are Still Failing the Grade

Let’s start with the uncomfortable truth. The country’s roads received a D+ in the 2025 ASCE Infrastructure Report Card. Though this is not exactly welcome news, it is technically an improvement from 2021, when roads got a straight D. Progress, yes. Celebration-worthy? Not quite.
America is home to 4.1 million miles of public roadways, and roughly 39% of major roads are in poor or mediocre condition, according to the 2025 ASCE report. That is nearly four in ten roads failing their basic function. Think about that the next time you merge onto a highway.
Part of the grade improvement for roads comes from the falling percentage of major roads in poor or mediocre condition since 2020, as well as a decline in road fatalities. Despite improvements, the average U.S. driver still loses $1,400 per year in vehicle costs and time driving on deteriorated and congested roads.
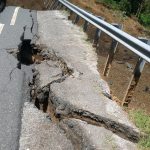
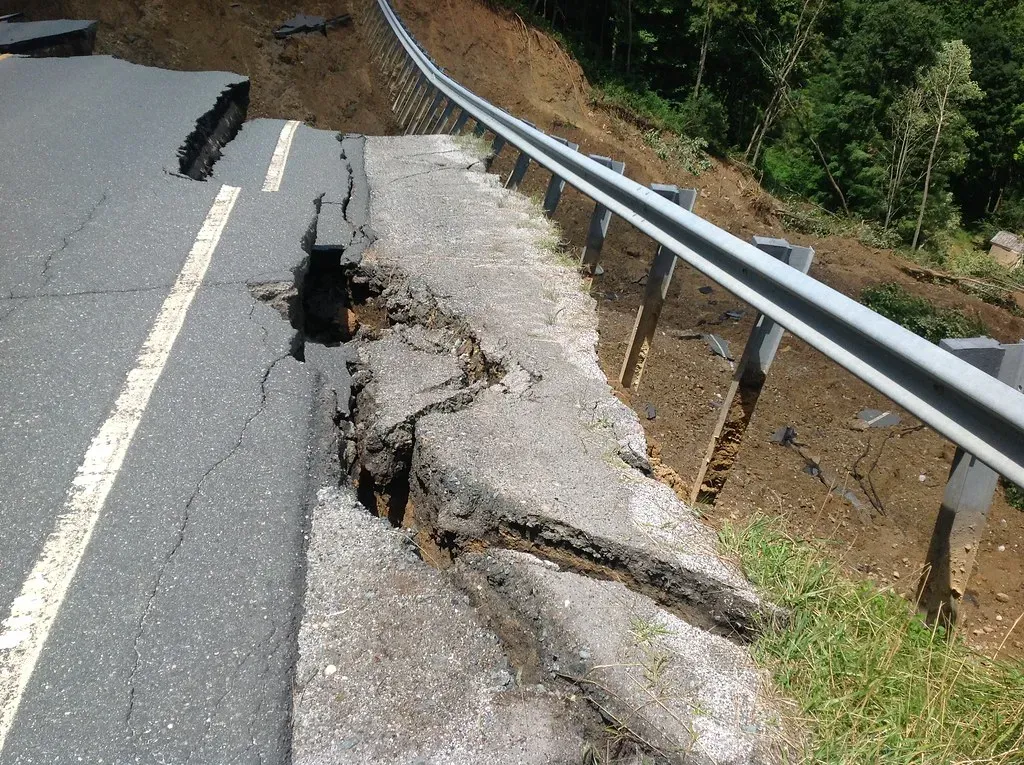
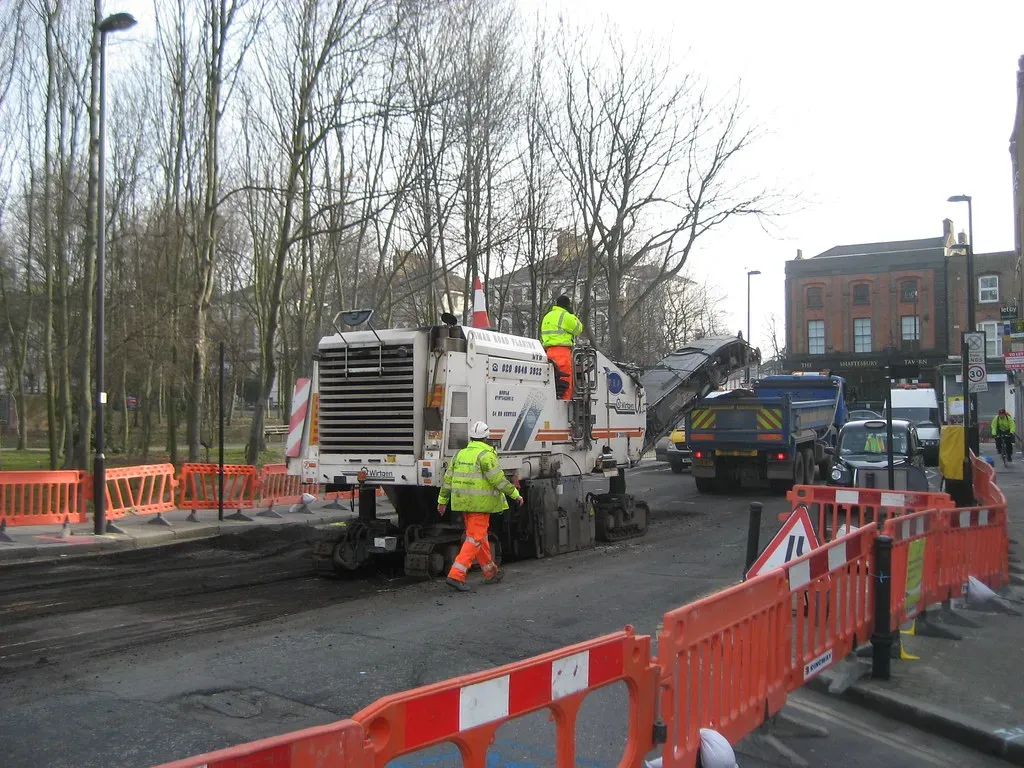
The Freeze-Thaw Cycle: Nature’s Pothole Machine

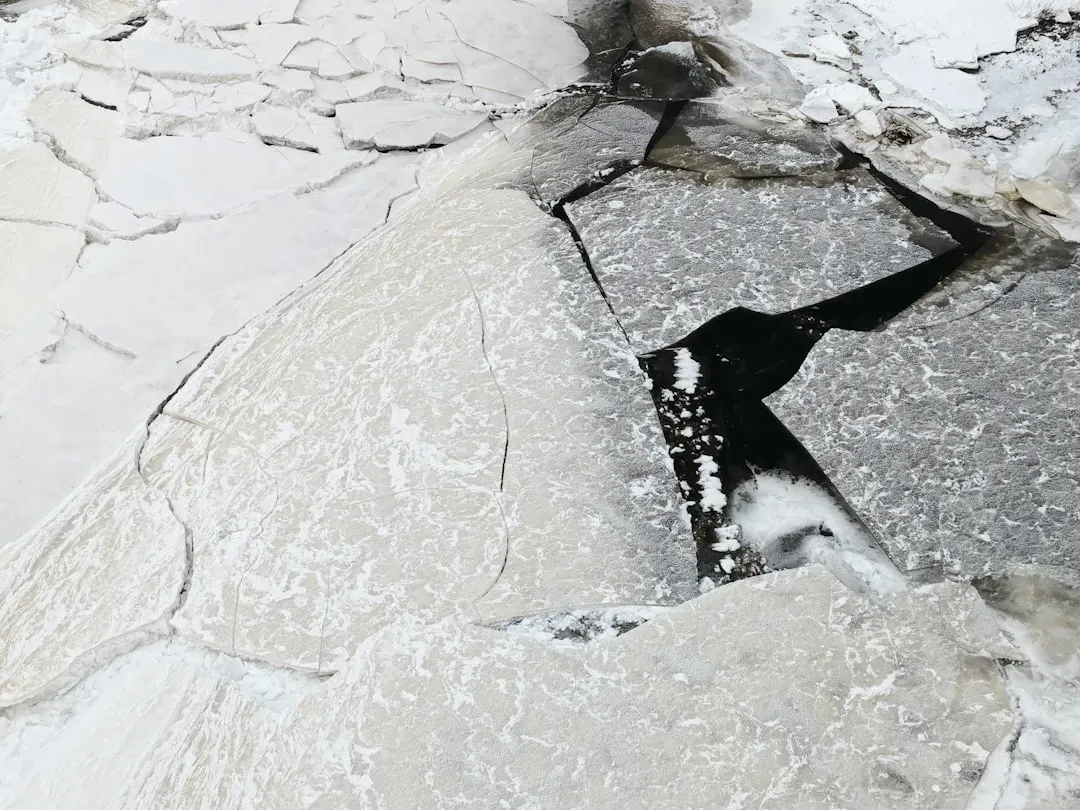
Here is the thing about potholes: they do not just appear randomly. There is real science behind why certain districts get hammered year after year. Moisture collects in pavement crevices and as temperatures fluctuate, it expands and contracts due to freezing and thawing. This breaks up the pavement and, combined with the weight of passing cars, eventually results in a pothole.
Pothole damage is roughly 60% more common in the Northeast than in the South and West. That is not a coincidence. It is a direct result of brutal winters, repeated freeze-thaw cycles, and older road infrastructure. New England roads take a punishment every single year that roads in Arizona or Florida simply never face.
Vermont’s long, harsh winters can cause road damage and delay repairs, adding to residents’ preoccupation with potholes. Climate change, according to the 2021 Vermont Climate Assessment from the University of Vermont, is contributing to these problems too. So it is not just getting worse. It is also getting more unpredictable.
The Billion-Dollar Bill Drivers Are Paying


It is one thing to talk about crumbling infrastructure in abstract terms. It is another thing entirely when the bill lands in your lap. The average cost of repairing pothole damage is $600 per vehicle, and damage caused by potholes cost drivers a total of $26.5 billion in 2021 alone, according to AAA. That number is staggering.
The American Automobile Association estimates that potholes cost U.S. drivers $3 billion annually in vehicle repairs. In New York City alone, potholes and road defects cost the city nearly $138 million in settlements for pedestrian injuries and vehicle damage over a six-year period.
Insurance claims due to pothole damage are highest in states with severe winter weather, such as Michigan, Ohio, and Pennsylvania. I know it sounds crazy, but in some of these states, your zip code genuinely affects how much car maintenance you pay per year. Location is destiny when it comes to potholes.
New York City: A Million Potholes and Counting

When we talk about sheer volume of pothole complaints and repairs, New York City occupies its own special category. The city’s 311 system receives an extraordinary number of road complaints every year, and the response numbers are equally eye-opening.
According to the verified facts drawn from the NYC Department of Transportation, New York City reported filling more than one million potholes in 2023, one of the highest annual totals in the city’s recorded history. To put that in perspective, that is more than 2,700 potholes filled every single day, on average.
The AAA estimates that potholes cost U.S. drivers $3 billion annually in vehicle repairs. In New York City alone, potholes and road defects cost the city nearly $138 million in settlements for pedestrian injuries and vehicle damage over just a six-year period. Filling potholes fast is not just civic pride. It is a financial survival strategy for the city.
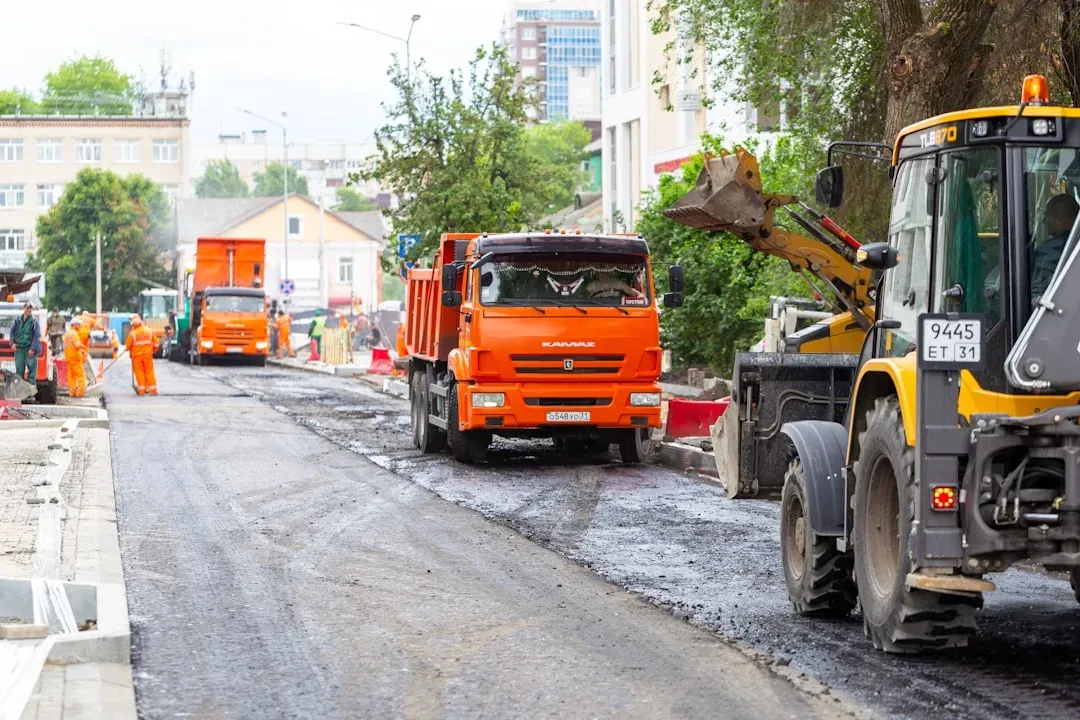
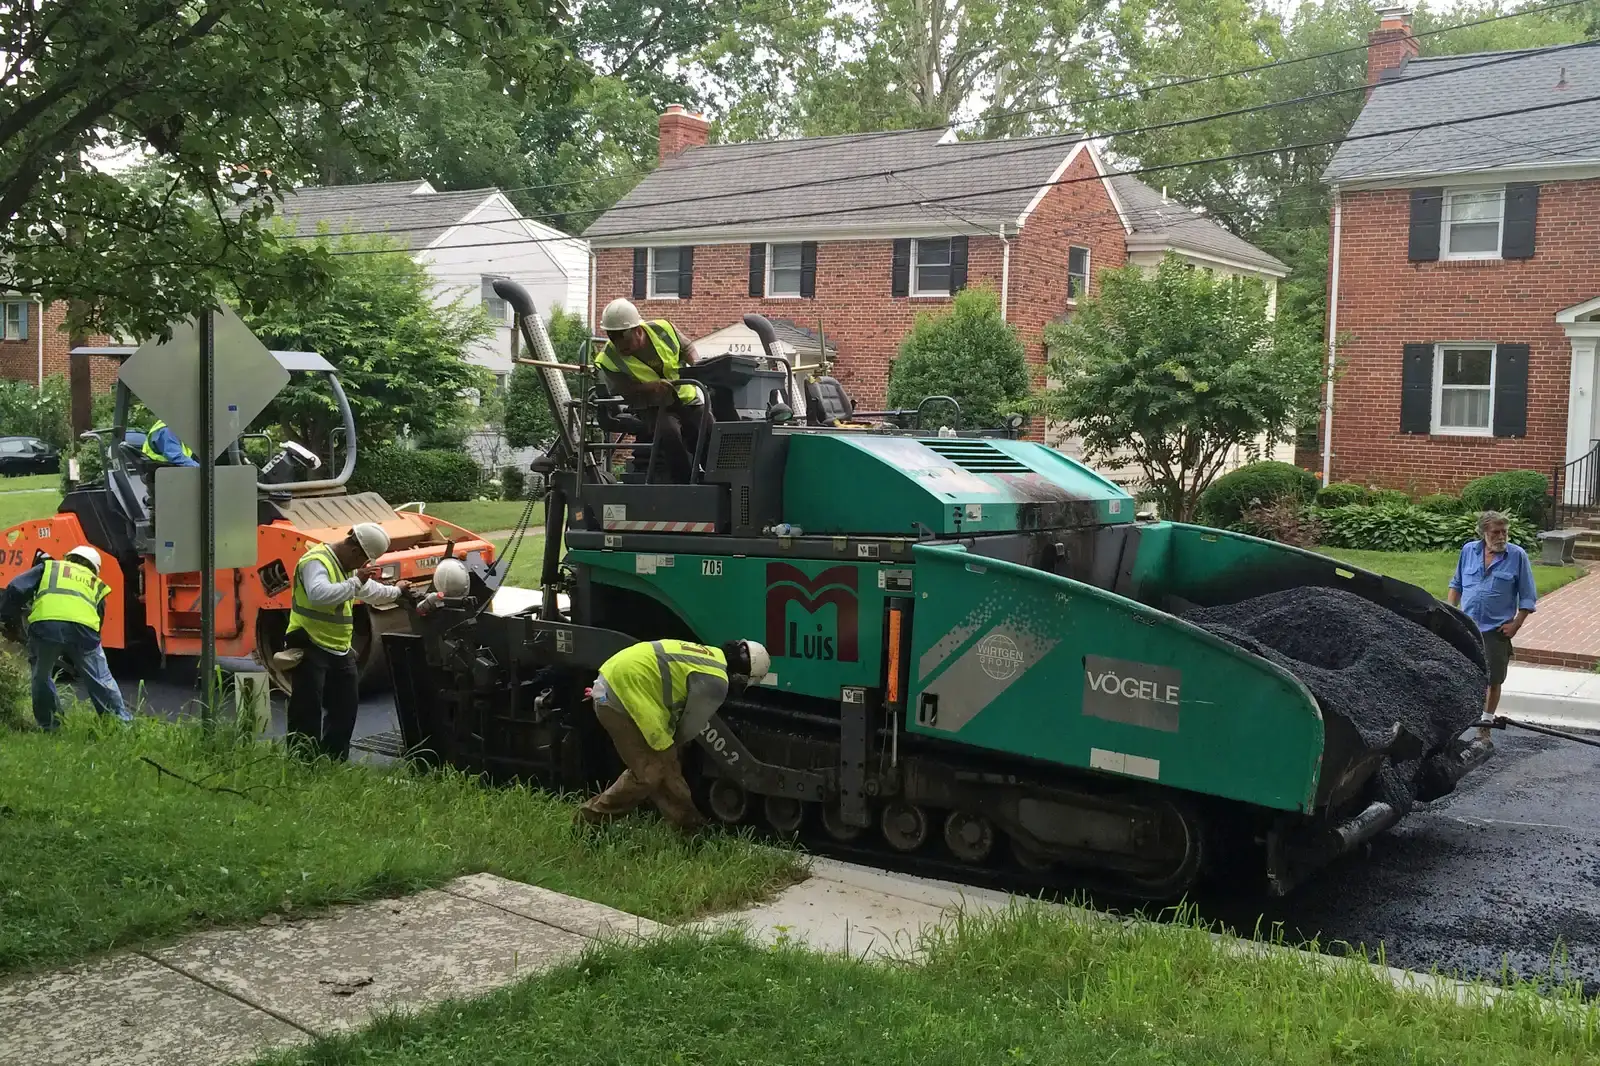
Chicago: One of the Largest Municipal Repair Programs in the Nation

Chicago is no slouch either. The city’s road challenges are well-documented, and its response has been significant. According to the Chicago Department of Transportation, Chicago filled roughly 570,000 potholes in 2023, making it one of the largest single-city repair programs in the entire United States.
In early 2024, the Chicago Department of Transportation fixed 30,000 more potholes than in the same period the previous year, largely because mild winter weather allowed crews to respond more efficiently. CDOT planned to resurface 150 miles of streets and alleys in 2024, including a two-mile stretch of South Ashland Avenue.
Still, sheer volume of repairs does not necessarily mean a city is winning. Chicago’s road network is enormous, and critics have long pointed out that reactive patching is a bit like bailing water from a leaking boat. You have to fix the underlying problems, not just the visible ones.
Rhode Island: Small State, Big Problem

Rhode Island has a reputation that precedes it in road quality discussions. Despite its small size, Rhode Island has something of a reputation for its potholes. A 2022 Providence Journal headline even suggested the state might be “the pothole capital of the United States.” That is a dubious distinction for a state that takes just over an hour to drive across.
With 23.4 complaints per 1,000 kilometers of road, Rhode Island topped state rankings in one analysis of pothole-related data. The state’s roads are chronically underfunded, aging, and consistently battered by Northeastern winters. Despite some infrastructure investment flowing in from federal sources, meaningful improvement remains slow.
Honestly, Rhode Island is a cautionary tale. Having access to federal money does not automatically translate into smooth roads if the state’s overall maintenance pipeline is broken. The funding helps, but process and prioritization matter just as much.
The Infrastructure Investment and Jobs Act: Hope or Hype?

The 2021 Infrastructure Investment and Jobs Act was supposed to change everything. The IIJA allocated $110 billion specifically towards major roadways, highways, and bridge infrastructure, along with $11 billion towards transportation safety programs. Those numbers sound transformative, and in many ways they are.
By May 2024, at the law’s halfway mark, approximately $454 billion, or 38% of the Act’s total funds, had been allocated to more than 56,000 projects. By the third anniversary in November 2024, that figure had grown to $568 billion, covering 68,000 projects. That is real momentum. Real projects. Real concrete being poured.
Although IIJA funding will continue to be distributed through the end of fiscal year 2026, widespread federal funding cuts, freezes, and delays threaten project implementation for many award recipients. In other words, the money is on the table, but getting it from Capitol Hill to a crumbling street in a mid-sized American city is not as simple as it sounds.
The Funding Gap That Will Not Go Away

Here is where things get truly sobering. Even with the historic IIJA investment flowing through the system, America faces a massive structural shortfall. While the 2025 Report Card shows that IIJA investments have started to pay off, ASCE projects a $3.7 trillion gap between current planned infrastructure investments and what must be done to put U.S. infrastructure in good working order, an increase from the $2.59 trillion gap reported four years ago.
The National Surface Transportation Policy and Revenue Study Commission estimates that the price to maintain the nation’s road infrastructure is $185 billion per year over the next 50 years, but the nation is currently spending only $68 billion a year. This funding gap means that potholes will continue to proliferate, putting more drivers at risk.
Think of it like a leaking roof. You can patch one section with a bucket, but if you never fix the underlying structure, the patches just multiply. That is essentially where the U.S. road system sits right now. Progress is real but so is the scale of what still needs to be done.
Which Districts Are Winning and Which Are Falling Behind?

Let’s be real: there is no single winner in this race. But the data gives us a clearer picture of who is at least running and who is still tying their shoes. Cities like New York and Chicago have invested heavily in sheer volume of repairs. San Jose is leading on smart detection technology. States like Texas, with high road counts but comparatively lower percentages of bridges in poor condition, show what consistent maintenance planning can achieve over time.
Based on service data covering 30 cities and areas across the U.S. with higher rates of road-related repairs, 25 of those 30 markets are east of the Mississippi River. The Northeast and Midwest remain the hardest-hit regions, not because of lack of effort but because of age, climate, and sheer density of roads relative to funding.
Cities with proactive pothole maintenance programs see a reduction of up to half in vehicle damage claims. That single statistic says everything. The districts that are winning are the ones that stopped waiting for complaints and started scanning proactively. Prevention is cheaper. It is also faster. The districts that are losing are the ones still stuck in the old reactive model, sending a crew out only after the pothole has already eaten someone’s tire.
Conclusion: The Road Ahead Is Longer Than It Looks

Progress is real. The 2025 ASCE report card improvement, the historic infrastructure funding, the rise of AI-assisted road scanning. These are all genuine steps forward. But let’s not confuse movement with arrival. The transportation sector generally receives grades at or lower than the report’s overall grade of C. Roads received a D+, and both aviation and transit fell at or below that same level.
The pothole pandemic is not a natural disaster. It is a policy failure, a funding failure, and in many places, a planning failure, playing out slowly over decades. Every district that embraces proactive maintenance, smart technology, and long-term investment is buying itself time. Every district that keeps patching and hoping is quietly falling further behind.
The question is not whether America can fix its roads. It clearly can. The real question is whether the political will and the funding commitment will outlast the next budget cycle. What do you think will actually change things, more money, better technology, or simply holding local officials accountable? Tell us in the comments.