

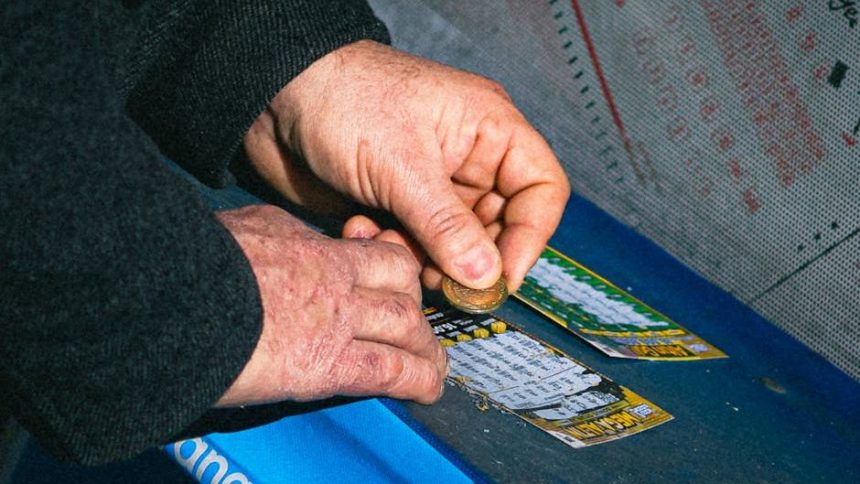
There’s a persistent belief among gamblers and casual observers alike that some neighborhoods are simply luckier than others. People swap stories about “hot” gas stations and convenience stores that seem to churn out winners week after week. The reality is far more interesting, and far more mathematical, than luck. Las Vegas sits at the center of this conversation for obvious reasons. The city’s identity is built on gambling, on the romance of long-shot wins. Yet when it comes to scratch-off lottery tickets specifically, the city holds a surprising secret that most residents don’t fully understand.
Las Vegas Has No State Lottery. Full Stop.
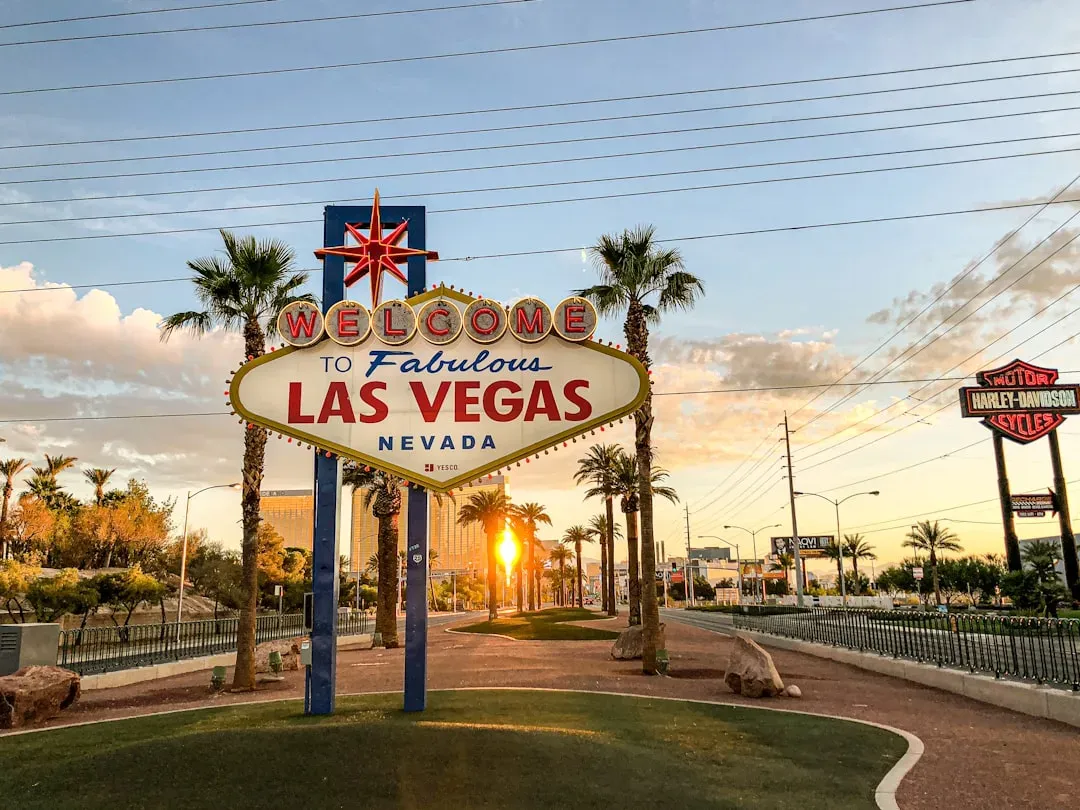
Before any ZIP code analysis can begin, there’s a foundational fact that reframes the entire premise. Nevada has no state-sanctioned lottery. The state constitution is explicit: “no lottery may be authorized by this State, nor may lottery tickets be sold.” That single legal reality changes everything about how we interpret “lottery winners” in the Las Vegas area.
Nevadans who want Mega Millions or Powerball tickets make the trip to border gas stations to buy them. So when people talk about Las Vegas ZIP codes producing winners, they’re really talking about residents buying tickets just outside the state. The “lucky ZIP code” story is, at its core, a story about proximity to state lines.
The Border Store Phenomenon: Where Winners Actually Come From

An April poll by the Nevada Independent found roughly 71 percent of respondents would support creating a statewide lottery. According to the California Lottery, the state’s two largest ticket retailers by annual revenue are The Lotto Store in Primm Valley and the Gold Ranch in Verdi, California. Both of those locations exist almost entirely because Las Vegas residents cross state lines to play.
Primm sits right on the Nevada-California border, roughly 35 miles from the Las Vegas Strip. The volume of tickets sold there is enormous by any measure, which means the volume of winners is proportionally enormous too. That’s not luck. That’s math driven by sheer customer traffic.
Volume Wins. Every Time.
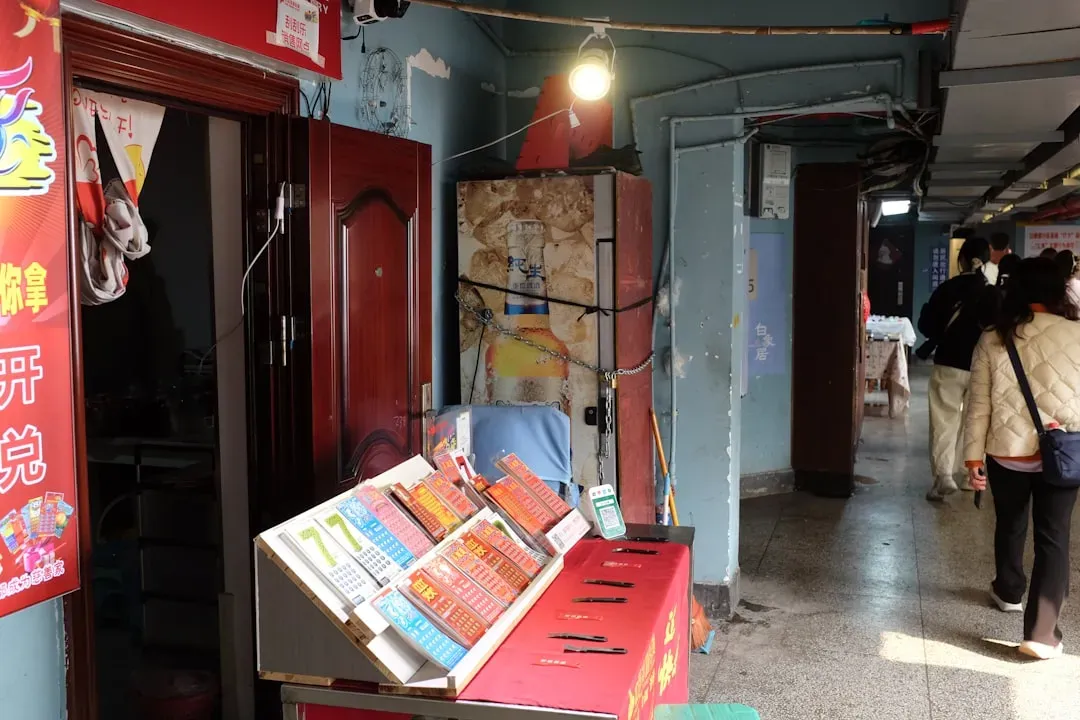
Overall chances of winning are calculated by dividing the total number of tickets in a game by the total number of prizes. The chances of winning are not influenced by where a ticket is sold. Scratch-offs are distributed at random, meaning the lottery and its retailers do not know where winning tickets will end up.
As would be expected with random distribution, regions with larger numbers of players tend to have a proportionate ratio of players winning. This is the core principle behind the “lucky store” myth. More tickets sold equals more winners, not a higher probability per ticket. The store isn’t lucky. It’s just busy.
The Math of Scratch-Off Ticket Distribution

Scratch-off ticket prizes are not random and tend to be evenly spaced throughout the rolls. The manufacturer has a certain dollar amount that they have to disperse for a game. This means winning tickets are spread across a fixed print run, and every individual ticket carries the same probability as any other in that same game.
The overall odds number is a weighted average across all prize tiers, but those tiers are wildly unequal. The vast majority of winning tickets in any game are low-value prizes. These tiny prizes so thoroughly dominate the count that the overall odds number is, in practice, a measure of how often you’ll win the bottom tier. Understanding that distinction matters enormously if you’re trying to read anything into ZIP code winner data.
Roughly one in ten scratch-off games still being sold have no top prizes remaining. This means someone buying those tickets has zero chance of hitting the advertised jackpot. Location tells you nothing about that. Only checking your state lottery’s prize-remaining page does.
The Push to Legalize: Nevada’s Ongoing Lottery Battle

The effort to bring a lottery to Nevada faces headwinds from the casino industry, which is taking an aggressive stance in 2025 and is determined to keep Nevada’s place as one of just five states without a statewide lottery. The casino lobby has significant motivation to block competition, even from scratch-off tickets sold at corner stores.
Soon after the 2023 legislative session closed, the Nevada Resort Association began an effort to persuade lawmakers that having a lottery doesn’t work in Nevada. If a Nevada lottery were ever approved and placed on the ballot, Las Vegas ZIP code winner data would shift dramatically overnight, purely because ticket access within state lines would expand by millions of sales.
Why Certain ZIP Codes Appear to Produce More Winners: The Income and Density Factor
Research from the Howard Center found that stores in the vast majority of states that sell lottery tickets are disproportionately concentrated in communities with lower levels of education, lower levels of income, and higher poverty rates, with larger populations of Black and Hispanic people. This concentration is not coincidental.
Partner offer
In neighborhoods with lottery retailers, the percentage of the population living in poverty is higher than in neighborhoods without lottery retailers across all 44 states analyzed. The median household income in neighborhoods with lottery retailers is lower than in neighborhoods without lottery retailers in 41 states and Washington, D.C. More retailers in a ZIP code means more tickets sold, which means more winners reported. Again, it’s volume, not luck.
Americans Are Spending More Than Ever. The House Still Wins.

Americans spent $104.7 billion on lottery tickets in 2024, according to the U.S. Census Bureau, a record high and a $1.4 billion increase from 2023. That works out to roughly $321 per capita in states that offer the lottery. The scale of that number helps explain why individual winning stories get so much attention. There are simply more tickets in circulation than ever before.
No state lottery returns more in prizes to its players than it collects in ticket sales. For most players, the math never works out: lottery proceeds are distributed among a small share of winners, and in no state do prizes paid out exceed what players spend. The perception that certain places produce winners is real. The implication that you’re more likely to win by buying there is not.
Lottery Retailers Are Mostly Local. That’s the Hidden Variable.
The Howard Center’s analysis of mobile phone location data shows that lottery retail customers are mostly local. The Howard Center used mobile location data from SafeGraph, a firm that collects information about foot traffic at more than 6 million U.S. stores. For each store, the aggregated data reveals the neighborhoods where a store’s customers live.
This is important for interpreting any ZIP code winner map. When a store in a dense, lower-income neighborhood shows a high winner count, it reflects that its customers live nearby and buy frequently. The prize isn’t gravitating toward that address. The address is simply where a high volume of local customers habitually shop.
Retailers With Higher Sales Get Bigger Bonuses. That Shapes the Data Too.
The stores that sell winning tickets often receive substantial bonuses. When a $349 million ticket was sold in Illinois in 2025, the retailer received a $500,000 bonus. These bonuses can transform small businesses overnight. High-volume retailers therefore have a financial incentive to promote their winner history, reinforcing the perception that some stores are luckier than others.
Some states have stronger lottery cultures than others. States with more lottery retailers per capita, more aggressive marketing, or more convenient purchasing options tend to see higher participation rates and, consequently, more winners. The winner clusters you see in data reflect infrastructure, not probability shifts.
What the “Lucky ZIP Code” Story Gets Right and Wrong
Nearly all ZIP codes in a given state perform very close to average on scratch-off win rates, but there are a few outliers. In Washington State, one ZIP code had nearly half of all scratch tickets winning something, while another had just 8 percent. Those outliers exist, but lottery officials and analysts attribute them to statistical variance rather than genuine location-based luck.
The vast majority of people who play scratch-off cards will lose, over the long run, about 70 percent of the money they spend. The odds are heavily stacked against you. The “winners” are the states, who keep about 30 percent of the roughly $60 billion spent on the lottery every year. That math doesn’t change based on your ZIP code, your state border proximity, or the store’s reputation.
Conclusion: The ZIP Code Was Never the Variable
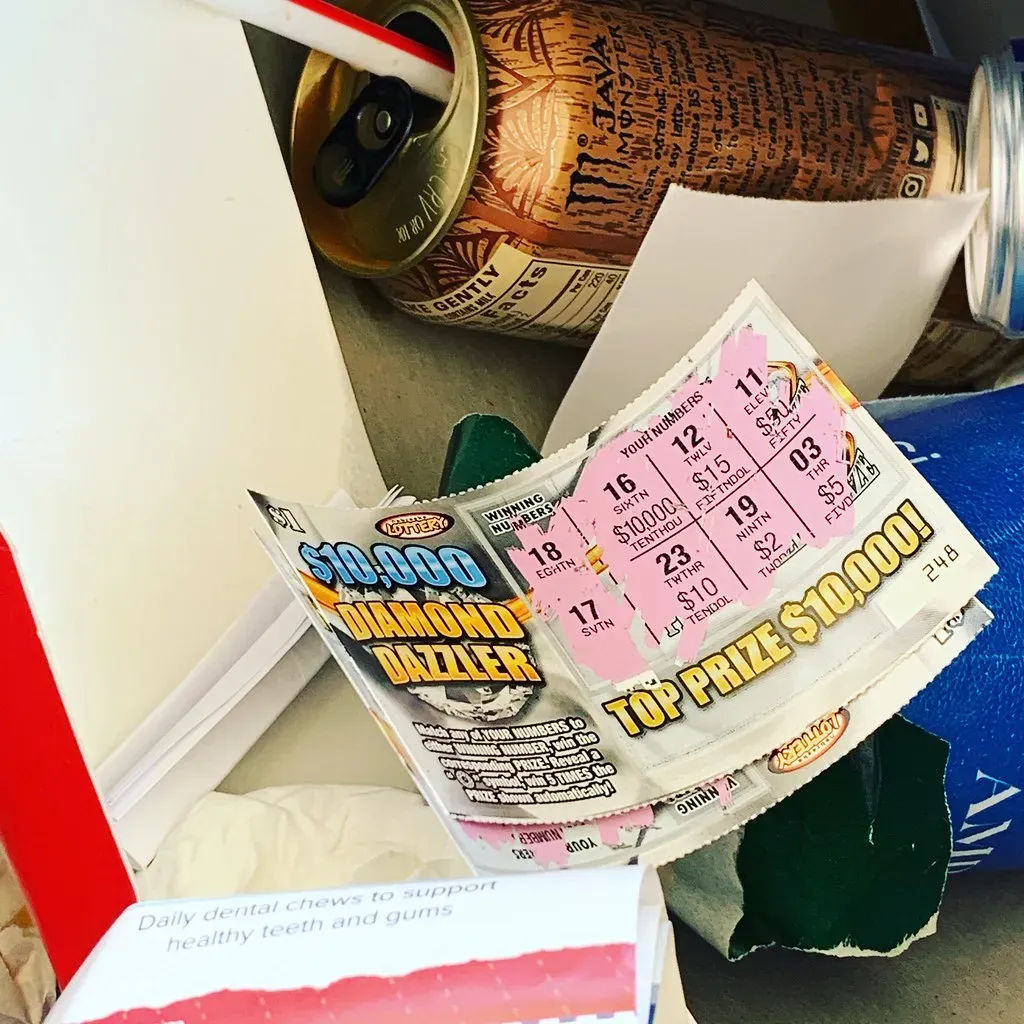
The myth of lucky Las Vegas ZIP codes producing disproportionate scratch-off winners collapses under one foundational fact: Nevada has no lottery. What residents of the Las Vegas metro area experience instead is the gravitational pull of state borders, high-volume cross-state retailers, and the psychological patterns that make wins at busy stores feel predictive when they’re simply probable.
The math of scratch-off tickets is fixed at the point of manufacture. Every ticket in a given game carries an identical probability, regardless of whether it’s sold at a Primm Valley border store or a gas station in suburban California. The real lesson embedded in “lucky ZIP code” stories isn’t about geography. It’s about what happens when you mix high volume, confirmation bias, and a genuine human desire to believe that some places are blessed.
If there’s one thing the numbers consistently show, it’s this: the most statistically likely outcome of any scratch-off ticket, in any ZIP code, is losing. That fact doesn’t make the game less appealing. It just makes the myth more persistent.
Partner offer
Planning a trip to Vegas?
Compare hotel rates and show tickets on VEGAS.com.