



A film can sit at the top of a streaming service’s homepage for a week and still tell you very little about how it did. Streaming companies don’t sell tickets, so they’ve had to build their own yardsticks for success.
Those yardsticks have changed more than once in the past few years. Here’s how the main measures work, who publishes them, and where they fall short.
Views, the Metric Netflix Leans On
Netflix defines a view as hours viewed divided by runtime for each title. A two hour film watched for a combined four million hours would therefore count as two million views. The idea is to approximate how many times the whole thing was watched.
Netflix has argued that this is the simplest way to measure engagement. It describes views as a metric all streamers can replicate that correlates highly with completers on Netflix. Other services have adopted similar math, and Disney+ and Hulu use it too.
Why Runtime Gets Divided Out
Raw hours favor long titles. A sprawling series simply has more minutes to accumulate, which makes comparisons with a ninety minute film unfair. Dividing by runtime evens that out, at least partly.
Netflix made the switch in mid 2023. It began tallying hours viewed weekly when it first shared data in 2020, then moved to views in June 2023. The change was driven largely by Wednesday’s shorter running time, since Stranger Things 4 had far more total hours but a much lower view count.
The 91 Day Window
A hit also needs a time frame. Netflix bases views for a title on the first 91 days since the release of each episode. That keeps a film that launched in January from being compared with one that launched last week.
The window has a visible effect on the charts. Titles released late in a reporting period carry an asterisk, because they haven’t had the full stretch to build an audience. Readers should keep that in mind before declaring a winner.
What the Half Year Reports Reveal

Netflix publishes its engagement data under the name What We Watched. For the first half of 2026, War Machine was its biggest title, with 147 million views. The Rip logged 136 million, Apex 129 million and Thrash 100 million.
The report also lists thousands of lesser titles. It covers every title that racked up over 50,000 hours viewed. That breadth is why the data is useful for spotting patterns, such as animated films becoming hits, with Swapped at 131 million views.
Weekly Top 10 Lists Tell a Different Story

Between those big reports, the weekly lists do the day to day work. Netflix says it will keep releasing its weekly lists of the top shows and movies. They show momentum, meaning which film is catching on right now.
Partner offer
The trade off is context. A weekly ranking can crown a film that opens strong and fades quickly. The longer reports are better at showing which titles hold an audience over months.
Hits Are Rarer Than the Charts Suggest
Even a blockbuster is a small slice of the whole. No single title accounts for more than one percent of total viewing on Netflix, and Squid Game Season 2, which had the most hours in that report, made up only seven tenths of one percent.
That helps explain how the company thinks about success. A film doesn’t need to dominate to be valuable. Netflix describes a mix of breakout hits with huge audiences and popular shows with smaller ones.
Nielsen as an Outside Check

Company numbers are self reported, so many analysts look to Nielsen for a second opinion. Its approach is different. Nielsen’s streaming content ratings cover services including Prime Video, Apple TV, Disney+, HBO Max, Hulu, Netflix, Paramount+ and Peacock, based on U.S. viewing through television.
It counts minutes rather than views, and only in the United States on TV screens. In the first half of 2026, Nielsen identified The Rip with 4.43 billion minutes and War Machine with 3.53 billion among top originals. The same two films led Netflix’s own list, which suggests the two methods point in a similar direction.
Faster Data, More Originals

Timing has been one of Nielsen’s weak spots. After years of reporting streaming viewership with a four week delay, it has cut that lag in half. Two weeks is still behind the pace of a theatrical box office report, but it’s closer to real time.
Nielsen’s data also shows how much originals now matter for movies. Just seven of the top 20 general audience movies were streaming originals last year, but that number jumped to 12 for the first half of this year.
Staying Power and the Limits of the Numbers

A strong opening is only part of a hit. KPop Demon Hunters drew 130 million views between January and June 2026, placing fourth, even though it had been streaming for more than a year. Long tail performance like that is hard to see in a launch week chart.
The metrics also have critics. Netflix’s overall viewership may be up by two percent, but the streamer can’t seem to shake concerns around its engagement metrics. Movie viewing dropped roughly three percent year over year, to 23 billion hours.
Where Reporting Stands in 2026
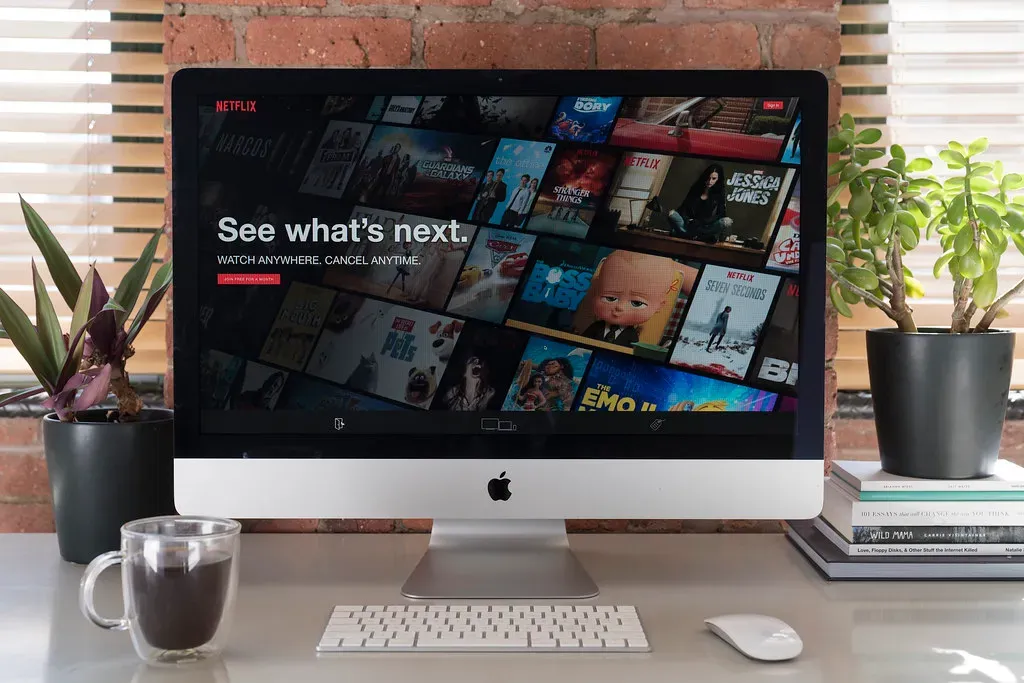
Netflix users worldwide spent about 97.7 billion hours watching series and films in the first half of 2026. After that report, Netflix will shift to publishing it annually in the first quarter, beginning in 2027.
The weekly lists will continue, and Nielsen’s weekly and half year charts remain the main outside reference. For now, views, minutes and completion windows are the working definition of a streaming hit.
Partner offer
Planning a trip to Vegas?
Compare hotel rates and show tickets on VEGAS.com.